Berkshire Hathaway 2008 Annual Report Download - page 30
Download and view the complete annual report
Please find page 30 of the 2008 Berkshire Hathaway annual report below. You can navigate through the pages in the report by either clicking on the pages listed below, or by using the keyword search tool below to find specific information within the annual report.-
 1
1 -
2
-
3
-
4
-
5
-
6
-
7
-
8
-
9
-
10
-
11
-
12
-
13
-
14
-
15
-
16
-
17
-
18
-
19
-
 20
20 -
 21
21 -
 22
22 -
 23
23 -
 24
24 -
 25
25 -
 26
26 -
 27
27 -
 28
28 -
 29
29 -
 30
30 -
 31
31 -
 32
32 -
 33
33 -
 34
34 -
 35
35 -
 36
36 -
 37
37 -
 38
38 -
 39
39 -
 40
40 -
41
-
42
-
43
-
44
-
45
-
46
-
47
-
48
-
49
-
50
-
51
-
52
-
53
-
54
-
55
-
56
-
57
-
58
-
59
-
60
-
61
-
62
-
63
-
64
-
65
-
66
-
67
-
68
-
69
-
70
-
71
-
72
-
73
-
74
-
75
-
76
-
77
-
78
-
79
-
80
-
81
-
82
-
83
-
84
-
85
-
86
-
87
-
88
-
89
-
90
-
91
-
92
-
93
-
94
-
95
-
96
-
97
-
98
-
99
-
100
 |
 |

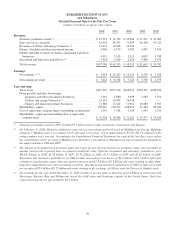
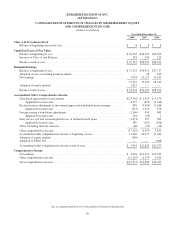
BERKSHIRE HATHAWAY INC.
and Subsidiaries
CONSOLIDATED STATEMENTS OF EARNINGS
(dollars in millions except per share amounts)
Year Ended December 31,
2008 2007 2006
Revenues:
Insurance and Other:
Insurance premiums earned ............................................ $ 25,525 $ 31,783 $ 23,964
Sales and service revenues ............................................ 65,854 58,243 51,803
Interest, dividend and other investment income ............................ 4,966 4,979 4,382
Investment gains/losses ............................................... (647) 5,405 1,697
95,698 100,410 81,846
Utilities and Energy:
Operating revenues .................................................. 12,668 12,376 10,301
Other ............................................................. 1,303 252 343
13,971 12,628 10,644
Finance and Financial Products:
Interest income ..................................................... 1,790 1,717 1,610
Investment gains/losses ............................................... 7 193 114
Derivative gains/losses ............................................... (6,821) (89) 824
Other ............................................................. 3,141 3,386 3,501
(1,883) 5,207 6,049
107,786 118,245 98,539
Costs and expenses:
Insurance and Other:
Insurance losses and loss adjustment expenses ............................. 16,259 21,010 13,068
Life and health insurance benefits ....................................... 1,840 1,786 1,618
Insurance underwriting expenses ....................................... 4,634 5,613 5,440
Cost of sales and services ............................................. 54,103 47,477 42,416
Selling, general and administrative expenses .............................. 8,052 7,098 5,932
Interest expense ..................................................... 156 164 195
85,044 83,148 68,669
Utilities and Energy:
Cost of sales and operating expenses .................................... 9,840 9,696 8,189
Interest expense ..................................................... 1,168 1,158 979
11,008 10,854 9,168
Finance and Financial Products:
Interest expense ..................................................... 639 588 550
Other ............................................................. 3,521 3,494 3,374
4,160 4,082 3,924
100,212 98,084 81,761
Earnings before income taxes and minority interests ......................... 7,574 20,161 16,778
Income taxes ....................................................... 1,978 6,594 5,505
Minority shareholders’ interests ........................................ 602 354 258
Net earnings ........................................................... $ 4,994 $ 13,213 $ 11,015
Average common shares outstanding * ................................... 1,548,960 1,545,751 1,541,807
Net earnings per common share * ......................................... $ 3,224 $ 8,548 $ 7,144
* Average shares outstanding include average Class A common shares and average Class B common shares determined on an
equivalent Class A common stock basis. Net earnings per common share shown above represents net earnings per equivalent
Class A common share. Net earnings per Class B common share is equal to one-thirtieth (1/30) of such amount or $107 per
share for 2008, $285 per share for 2007 and $238 per share for 2006.
See accompanying Notes to Consolidated Financial Statements
28