Berkshire Hathaway 2008 Annual Report Download - page 76
Download and view the complete annual report
Please find page 76 of the 2008 Berkshire Hathaway annual report below. You can navigate through the pages in the report by either clicking on the pages listed below, or by using the keyword search tool below to find specific information within the annual report.-
 1
1 -
2
-
3
-
4
-
5
-
6
-
7
-
8
-
9
-
10
-
11
-
12
-
13
-
14
-
15
-
16
-
17
-
18
-
19
-
20
-
21
-
22
-
23
-
24
-
25
-
26
-
27
-
28
-
29
-
30
-
31
-
32
-
33
-
34
-
35
-
36
-
37
-
38
-
39
-
40
-
41
-
42
-
43
-
44
-
45
-
46
-
47
-
48
-
49
-
50
-
51
-
52
-
53
-
54
-
55
-
56
-
57
-
58
-
59
-
60
-
61
-
62
-
63
-
64
-
65
-
 66
66 -
 67
67 -
 68
68 -
 69
69 -
 70
70 -
 71
71 -
 72
72 -
 73
73 -
 74
74 -
 75
75 -
 76
76 -
 77
77 -
 78
78 -
 79
79 -
 80
80 -
 81
81 -
 82
82 -
 83
83 -
 84
84 -
 85
85 -
 86
86 -
87
-
88
-
89
-
90
-
91
-
92
-
93
-
94
-
95
-
96
-
97
-
98
-
99
-
100
 |
 |

Management’s Discussion (Continued)
Manufacturing, Service and Retailing (Continued)
Other service (Continued)
In 2008, revenues of the group were $8,435 million, an increase of $643 million (8%) over 2007. The inclusion of twelve
months of revenues from TTI in 2008 versus nine months in 2007 accounted for over 80% of the revenue increase. Excluding the
impact of TTI, other service revenues in 2008 increased 2% over 2007.
Pre-tax earnings of $971 million in 2008, were relatively unchanged from 2007. The impact from the TTI acquisition and
increased earnings of FlightSafety was offset by lower earnings from NetJets and Pampered Chef. In the fourth quarter of 2008,
NetJets, and to a lesser degree Pampered Chef, experienced a significant reduction in revenue as general economic conditions
worsened. This resulted in lower customer usage and demand which negatively affected operating margins. In addition, NetJets
incurred charges of $54 million to writedown the aircraft fleet.
Revenues from the other service businesses in 2007 increased $1,981 million (34%) and pre-tax earnings increased $310
million (47%) as compared to 2006. The increase in revenues and pre-tax earnings in 2007 versus 2006 was attributable to the
impact of business acquisitions (primarily TTI and Business Wire) as well as increased revenues and pre-tax earnings from
FlightSafety and NetJets. Both of these businesses benefited in 2007 from higher equipment (simulators and aircraft) utilization
rates and from increased customer demand.
Retailing
Berkshire’s retailing operations consist of four home furnishings (Nebraska Furniture Mart, R.C. Willey, Star Furniture and
Jordan’s) and three jewelry (Borsheims, Helzberg and Ben Bridge) retailers. See’s Candies is also included in this group. Retailing
revenues were $3,104 million in 2008, a decrease of $293 million (9%) versus 2007. Pre-tax earnings of $163 million in 2008 declined
$111 million (41%) compared to 2007. Seven of the eight retail operations experienced revenue declines and all eight of these
operations had declines in earnings compared to 2007. During the first nine months of 2008, as the impact of the economic recession in
the U.S. worsened, consumer spending declined. In the fourth quarter of 2008, the decline accelerated and conditions for most retailers
throughout the U.S. deteriorated. Fourth quarter of 2008 revenues and pre-tax earnings of Berkshire’s retailers declined 17% and 33%,
respectively, versus the fourth quarter of 2007.
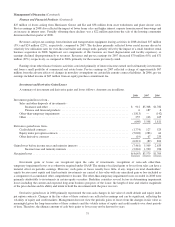
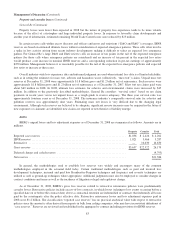
Finance and Financial Products
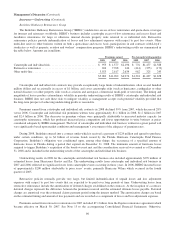
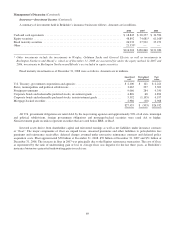
A summary of revenues and earnings from Berkshire’s finance and financial products businesses follows. Amounts are in
millions.
Revenues Earnings
2008 2007 2006 2008 2007 2006
Manufactured housing and finance ............................... $3,560 $3,665 $3,570 $206 $ 526 $ 513
Furniture/transportation equipment leasing ......................... 773 810 880 87 111 182
Other ....................................................... 614 644 674 494 369 462
$4,947 $5,119 $5,124
Pre-tax earnings .............................................. 787 1,006 1,157
Income taxes and minority interests ............................... 308 374 425
$479 $ 632 $ 732
Revenues from manufactured housing and finance activities (Clayton Homes) in 2008 decreased $105 million (3%) from
2007. The decrease included a 9% decline from home sales, reflecting declines in units sold and average selling prices. In
addition, revenues in 2007 included approximately $90 million from the housing communities division which was sold in the
first quarter of 2008. Partially offsetting these declines was an increase in interest income from installment loans. The increase
in interest income reflects higher average installment loan balances in 2008 versus 2007. Installment loan balances were
approximately $12.6 billion as of December 31, 2008, an increase of approximately $1.5 billion since December 31, 2007. The
increase was principally due to loan portfolio acquisitions.
Pre-tax earnings of Clayton Homes in 2008 declined $320 million (61%) from 2007. Pre-tax earnings in 2008 included a
$125 million increase in the provision for estimated loan losses due to changes in loan collection and recovery assumptions,
74