Berkshire Hathaway 2008 Annual Report Download - page 74
Download and view the complete annual report
Please find page 74 of the 2008 Berkshire Hathaway annual report below. You can navigate through the pages in the report by either clicking on the pages listed below, or by using the keyword search tool below to find specific information within the annual report.-
 1
1 -
2
-
3
-
4
-
5
-
6
-
7
-
8
-
9
-
10
-
11
-
12
-
13
-
14
-
15
-
16
-
17
-
18
-
19
-
20
-
21
-
22
-
23
-
24
-
25
-
26
-
27
-
28
-
29
-
30
-
31
-
32
-
33
-
34
-
35
-
36
-
37
-
38
-
39
-
40
-
41
-
42
-
43
-
44
-
45
-
46
-
47
-
48
-
49
-
50
-
51
-
52
-
53
-
54
-
55
-
56
-
57
-
58
-
59
-
60
-
61
-
62
-
63
-
 64
64 -
 65
65 -
 66
66 -
 67
67 -
 68
68 -
 69
69 -
 70
70 -
 71
71 -
 72
72 -
 73
73 -
 74
74 -
 75
75 -
 76
76 -
 77
77 -
 78
78 -
 79
79 -
 80
80 -
 81
81 -
 82
82 -
 83
83 -
 84
84 -
85
-
86
-
87
-
88
-
89
-
90
-
91
-
92
-
93
-
94
-
95
-
96
-
97
-
98
-
99
-
100
 |
 |

Management’s Discussion (Continued)
Manufacturing, Service and Retailing
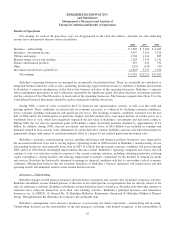
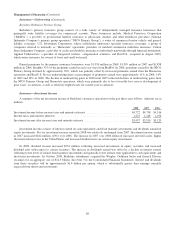
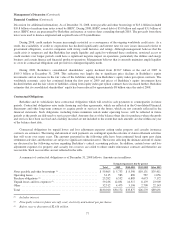
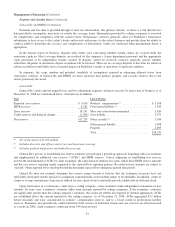
A summary of revenues and earnings of Berkshire’s manufacturing, service and retailing businesses for each of the past
three years follows. Amounts are in millions.
Revenues Earnings
2008 2007 2006 2008 2007 2006
Marmon ................................................ $ 5,529 $ — $ — $ 733 $ — $ —
McLane Company ........................................ 29,852 28,079 25,693 276 232 229
Shaw Industries .......................................... 5,052 5,373 5,834 205 436 594
Other manufacturing ...................................... 14,127 14,459 11,988 1,675 2,037 1,756
Other service * .......................................... 8,435 7,792 5,811 971 968 658
Retailing ............................................... 3,104 3,397 3,334 163 274 289
$66,099 $59,100 $52,660
Pre-tax earnings .......................................... $4,023 $3,947 $3,526
Income taxes and minority interests .......................... 1,740 1,594 1,395
$2,283 $2,353 $2,131
*Management evaluates the results of NetJets using accounting standards for recognition of revenue and planned major
maintenance expenses that were generally accepted when Berkshire acquired NetJets but are no longer acceptable due to
subsequent changes adopted by the FASB. Revenues and pre-tax earnings for the other service businesses shown above
reflect these prior revenue and expense recognition methods. Revenues shown above exceeded the amounts reported in
Berkshire’s Consolidated Financial Statements by $130 million in 2008, $709 million in 2007 and $781 million in 2006.
Pre-tax earnings in this table exceeded (was less than) the amounts included in the Consolidated Financial Statements by ($4
million) in 2008, $48 million in 2007 and $79 million in 2006.
Marmon
Berkshire acquired a 60% interest in Marmon Holdings, Inc. (“Marmon”) on March 18, 2008. During the second quarter of
2008, Berkshire acquired additional shares and currently has a 63.6% interest. Marmon’s operating results are included in
Berkshire’s consolidated results and in the preceding table from the date of the initial acquisition. Marmon consists of
approximately 130 manufacturing and service businesses that operate independently within 11 diverse business sectors. See
Note 2 to the Consolidated Financial Statements for an additional description of Marmon’s operations. For the twelve months
ending December 31, 2008, Marmon’s consolidated revenues and operating income were $6,960 million and $977 million,
respectively, compared to $6,934 million and $946 million, respectively in 2007.
McLane Company
McLane Company, Inc., (“McLane”) is a wholesale distributor of grocery and non-food products to retailers, convenience
stores and restaurants. McLane’s business is marked by high sales volume and very low profit margins. McLane’s revenues of
$29,852 million in 2008 increased $1,773 million (6%) compared to 2007 which increased $2,386 million (9%) compared to
2006. The revenue increases in both 2008 and 2007 reflected additional grocery and foodservice customers as well as
manufacturer price increases and state excise tax increases.
Pre-tax earnings in 2008 increased $44 million over 2007, which was relatively unchanged from 2006. The increase in
2008 reflected the increased sales and to a lesser degree a slight increase in gross margins. The gross margin rate was 5.91% in
2008 compared to 5.79% in 2007. The comparative increase in the gross margin rate reflected price changes related to certain
categories of grocery products and the impact of a heavy liquids sales surcharge. Operating expenses in 2008 as a percentage of
revenues were relatively unchanged compared to 2007. Approximately one-third of McLane’s annual revenues are from
Wal-Mart. A curtailment of purchasing by Wal-Mart could have a material adverse impact on McLane’s earnings.
Shaw Industries
Shaw Industries (“Shaw”) is the world’s largest manufacturer of tufted broadloom carpets and is a full-service flooring
company. Shaw revenues of $5,052 million in 2008 declined $321 million (6%) compared to 2007. The revenue decrease was
primarily due to a reduction in year-to-date residential carpet sales volume, partially offset by higher average selling prices and
72