Berkshire Hathaway 2008 Annual Report Download - page 78
Download and view the complete annual report
Please find page 78 of the 2008 Berkshire Hathaway annual report below. You can navigate through the pages in the report by either clicking on the pages listed below, or by using the keyword search tool below to find specific information within the annual report.-
 1
1 -
2
-
3
-
4
-
5
-
6
-
7
-
8
-
9
-
10
-
11
-
12
-
13
-
14
-
15
-
16
-
17
-
18
-
19
-
20
-
21
-
22
-
23
-
24
-
25
-
26
-
27
-
28
-
29
-
30
-
31
-
32
-
33
-
34
-
35
-
36
-
37
-
38
-
39
-
40
-
41
-
42
-
43
-
44
-
45
-
46
-
47
-
48
-
49
-
50
-
51
-
52
-
53
-
54
-
55
-
56
-
57
-
58
-
59
-
60
-
61
-
62
-
63
-
64
-
65
-
66
-
67
-
 68
68 -
 69
69 -
 70
70 -
 71
71 -
 72
72 -
 73
73 -
 74
74 -
 75
75 -
 76
76 -
 77
77 -
 78
78 -
 79
79 -
 80
80 -
 81
81 -
 82
82 -
 83
83 -
 84
84 -
 85
85 -
 86
86 -
 87
87 -
 88
88 -
89
-
90
-
91
-
92
-
93
-
94
-
95
-
96
-
97
-
98
-
99
-
100
 |
 |
Management’s Discussion (Continued)
Investment and Derivative Gains/Losses (Continued)
Losses from credit default contracts in 2008 derived primarily from valuation increases due to significant widening of
credit default spreads during the fourth quarter of 2008 with respect to the non-investment grade issuers included in the high
yield index contracts and the credit default spreads of certain states and municipalities. The estimated fair value of credit default
contracts at December 31, 2008 was $4.1 billion, an increase of $2.3 billion from December 31, 2007. The year-to-date increase
included fair value pre-tax losses of $1.8 billion and premiums from contracts entered into in 2008 of $633 million, partially
offset by loss payments of $152 million. In January 2009, there were defaults by six companies included in the high yield
indexes. Estimated payments in the first quarter of 2009 related to these defaults are expected to be approximately $750 million.
The estimated fair value of equity index put option contracts at December 31, 2008 was $10.0 billion, an increase of
approximately $5.4 billion from December 31, 2007 and an increase of $3.3 billion from September 30, 2008. The year-to-date
increase included pre-tax losses of $5.0 billion due to changes in fair values and premiums from new contracts. There have been
no loss payments under equity index put option contracts. Berkshire’s losses from equity index put option contracts in 2008
reflected index value declines of between 30% and 45% in 2008 across the four indexes. During the fourth quarter of 2008 these
indexes declined between 10% and 22%. These contracts expire beginning in 2019 with the last expiration in 2028. Any loss
payments under these contracts will be based on the net decline in the underlying index below the strike price in each contract as
of the expiration date of the contract.
Financial Condition
Berkshire’s balance sheet continues to reflect significant liquidity. Consolidated cash and invested assets, excluding assets
of utilities and energy and finance and financial products businesses, was approximately $122.0 billion at December 31, 2008
(including cash and cash equivalents of $24.3 billion) and $141.2 billion at December 31, 2007 (including cash and cash
equivalents of $37.7 billion). Berkshire’s invested assets are held predominantly in its insurance businesses. The decline in cash
and invested assets is primarily due to a significant reduction in the carrying amount of equity securities resulting from the
worldwide economic crisis.
Berkshire acquired a 60% interest in Marmon Holdings, Inc. (“Marmon”) for $4.5 billion on March 18, 2008. In the second
quarter of 2008, Berkshire acquired additional shares and currently owns 63.6% of Marmon. Berkshire has agreed to acquire the
remaining minority shareholders’ interests in Marmon between 2011 and 2014 for consideration based on Marmon’s future
earnings.
During the fourth quarter of 2008, Berkshire invested $6.5 billion in subordinated notes and preferred stock of the Wm.
Wrigley, Jr. Company in connection with Mars, Incorporated’s acquisition of that entity. In addition, Berkshire invested
$5 billion in Goldman Sachs perpetual preferred stock and common stock warrants and $3 billion in General Electric Company
perpetual preferred stock and common stock warrants. These investments were funded with available cash.
Notes payable and other borrowings of the insurance and other businesses were $4.3 billion (includes about $2.3 billion issued
or guaranteed by Berkshire Hathaway Inc.) at December 31, 2008, an increase of $1.7 billion from December 31, 2007, primarily
due to increases in short-term borrowings (principally NetJets) and debt of businesses acquired in 2008, (principally Marmon).
MidAmerican’s capital expenditures were $3.9 billion in 2008 and are forecasted to be approximately $3.3 billion in 2009.
MidAmerican expects to fund these capital expenditures with cash flows from operations and debt proceeds. Certain of its
borrowings are secured by certain assets of its regulated utility subsidiaries. Notes payable and other borrowings of
MidAmerican maturing in 2009 are $1.26 billion with an additional $1.26 billion due before the end of 2011. Berkshire has
committed until February 28, 2011 to provide up to $3.5 billion of additional capital to MidAmerican to permit the repayment of
its debt obligations or to fund MidAmerican’s regulated utility subsidiaries. Berkshire has not and does not intend to guarantee
the repayment of debt by MidAmerican or any of its subsidiaries.
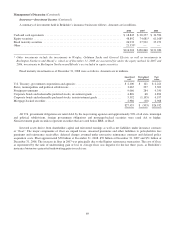
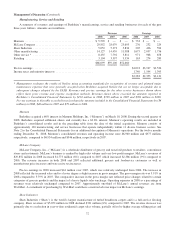
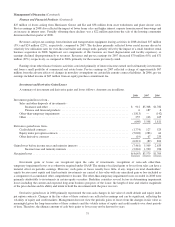
Assets of the finance and financial products businesses as of December 31, 2008 and 2007 consisted primarily of loans and
finance receivables, fixed maturity securities and cash and cash equivalents. Liabilities were $30.7 billion as of December 31,
2008 and $22.0 billion at December 31, 2007. The increase from 2007 primarily relates to an increase of $7.7 billion in
derivative contract liabilities (see Note 11 to the Consolidated Financial Statements and the preceding section of Management’s
76