Berkshire Hathaway 2008 Annual Report Download - page 12
Download and view the complete annual report
Please find page 12 of the 2008 Berkshire Hathaway annual report below. You can navigate through the pages in the report by either clicking on the pages listed below, or by using the keyword search tool below to find specific information within the annual report.-
 1
1 -
 2
2 -
 3
3 -
 4
4 -
 5
5 -
 6
6 -
 7
7 -
 8
8 -
 9
9 -
 10
10 -
 11
11 -
 12
12 -
 13
13 -
 14
14 -
 15
15 -
 16
16 -
 17
17 -
 18
18 -
 19
19 -
 20
20 -
 21
21 -
 22
22 -
23
-
24
-
25
-
26
-
27
-
28
-
29
-
30
-
31
-
32
-
33
-
34
-
35
-
36
-
37
-
38
-
39
-
40
-
41
-
42
-
43
-
44
-
45
-
46
-
47
-
48
-
49
-
50
-
51
-
52
-
53
-
54
-
55
-
56
-
57
-
58
-
59
-
60
-
61
-
62
-
63
-
64
-
65
-
66
-
67
-
68
-
69
-
70
-
71
-
72
-
73
-
74
-
75
-
76
-
77
-
78
-
79
-
80
-
81
-
82
-
83
-
84
-
85
-
86
-
87
-
88
-
89
-
90
-
91
-
92
-
93
-
94
-
95
-
96
-
97
-
98
-
99
-
100
 |
 |

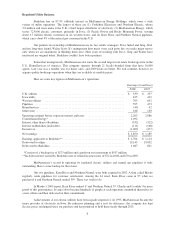
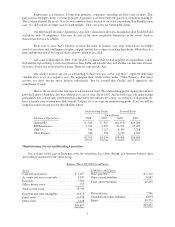
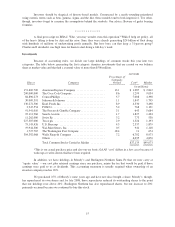
Earnings Statement (in millions)
2008 2007 2006
Revenues ......................................................... $66,099 $59,100 $52,660
Operating expenses (including depreciation of $1,280 in 2008, $955 in 2007 and
$823 in 2006) .................................................... 61,937 55,026 49,002
Interest expense .................................................... 139 127 132
Pre-tax earnings .................................................... 4,023* 3,947* 3,526*
Income taxes and minority interests ..................................... 1,740 1,594 1,395
Net income ........................................................ $ 2,283 $ 2,353 $ 2,131
*Does not include purchase-accounting adjustments.
This motley group, which sells products ranging from lollipops to motor homes, earned an impressive
17.9% on average tangible net worth last year. It’s also noteworthy that these operations used only minor
financial leverage in achieving that return. Clearly we own some terrific businesses. We purchased many of
them, however, at large premiums to net worth – a point reflected in the goodwill item shown on our balance
sheet – and that fact reduces the earnings on our average carrying value to 8.1%.
Though the full-year result was satisfactory, earnings of many of the businesses in this group hit the
skids in last year’s fourth quarter. Prospects for 2009 look worse. Nevertheless, the group retains strong earning
power even under today’s conditions and will continue to deliver significant cash to the parent company. Overall,
these companies improved their competitive positions last year, partly because our financial strength let us make
advantageous tuck-in acquisitions. In contrast, many competitors were treading water (or sinking).
The most noteworthy of these acquisitions was Iscar’s late-November purchase of Tungaloy, a leading
Japanese producer of small tools. Charlie and I continue to look with astonishment – and appreciation! – at the
accomplishments of Iscar’s management. To secure one manager like Eitan Wertheimer, Jacob Harpaz or Danny
Goldman when we acquire a company is a blessing. Getting three is like winning the Triple Crown. Iscar’s
growth since our purchase has exceeded our expectations – which were high – and the addition of Tungaloy will
move performance to the next level.
MiTek, Benjamin Moore, Acme Brick, Forest River, Marmon and CTB also made one or more
acquisitions during the year. CTB, which operates worldwide in the agriculture equipment field, has now picked
up six small firms since we purchased it in 2002. At that time, we paid $140 million for the company. Last year
its pre-tax earnings were $89 million. Vic Mancinelli, its CEO, followed Berkshire-like operating principles long
before our arrival. He focuses on blocking and tackling, day by day doing the little things right and never getting
off course. Ten years from now, Vic will be running a much larger operation and, more important, will be
earning excellent returns on invested capital.
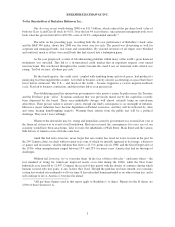
Finance and Financial Products
I will write here at some length about the mortgage operation of Clayton Homes and skip any financial
commentary, which is summarized in the table at the end of this section. I do this because Clayton’s recent
experience may be useful in the public-policy debate about housing and mortgages. But first a little background.
Clayton is the largest company in the manufactured home industry, delivering 27,499 units last year.
This came to about 34% of the industry’s 81,889 total. Our share will likely grow in 2009, partly because much
of the rest of the industry is in acute distress. Industrywide, units sold have steadily declined since they hit a peak
of 372,843 in 1998.
10