Berkshire Hathaway 2008 Annual Report Download - page 63
Download and view the complete annual report
Please find page 63 of the 2008 Berkshire Hathaway annual report below. You can navigate through the pages in the report by either clicking on the pages listed below, or by using the keyword search tool below to find specific information within the annual report.-
 1
1 -
2
-
3
-
4
-
5
-
6
-
7
-
8
-
9
-
10
-
11
-
12
-
13
-
14
-
15
-
16
-
17
-
18
-
19
-
20
-
21
-
22
-
23
-
24
-
25
-
26
-
27
-
28
-
29
-
30
-
31
-
32
-
33
-
34
-
35
-
36
-
37
-
38
-
39
-
40
-
41
-
42
-
43
-
44
-
45
-
46
-
47
-
48
-
49
-
50
-
51
-
52
-
 53
53 -
 54
54 -
 55
55 -
 56
56 -
 57
57 -
 58
58 -
 59
59 -
 60
60 -
 61
61 -
 62
62 -
 63
63 -
 64
64 -
 65
65 -
 66
66 -
 67
67 -
 68
68 -
 69
69 -
 70
70 -
 71
71 -
 72
72 -
 73
73 -
74
-
75
-
76
-
77
-
78
-
79
-
80
-
81
-
82
-
83
-
84
-
85
-
86
-
87
-
88
-
89
-
90
-
91
-
92
-
93
-
94
-
95
-
96
-
97
-
98
-
99
-
100
 |
 |

Notes to Consolidated Financial Statements (Continued)
(21) Business segment data (Continued)
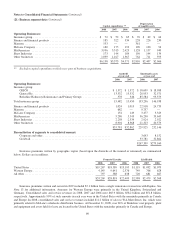
Premiums written and earned by the property/casualty and life/health insurance businesses are summarized below (in
millions). Property/Casualty Life/Health
2008 2007 2006 2008 2007 2006
Premiums Written:
Direct .............................................. $16,953 $16,056 $15,729
Assumed ........................................... 7,960 13,316 7,224 $2,690 $2,579 $2,476
Ceded .............................................. (704) (554) (544) (102) (100) (108)
$24,209 $28,818 $22,409 $2,588 $2,479 $2,368
Premiums Earned:
Direct .............................................. $16,269 $16,076 $15,453
Assumed ........................................... 7,332 13,744 6,746 $2,682 $2,564 $2,471
Ceded .............................................. (656) (499) (599) (102) (102) (107)
$22,945 $29,321 $21,600 $2,580 $2,462 $2,364
(22) Quarterly data
A summary of revenues and earnings by quarter for each of the last two years is presented in the following table. This
information is unaudited. Dollars are in millions, except per share amounts. 1st
Quarter
2nd
Quarter
3rd
Quarter
4th
Quarter
2008
Revenues ............................................................. $25,175 $30,093 $27,926 $24,592
Net earnings * ......................................................... 940 2,880 1,057 117
Net earnings per equivalent Class A common share ............................ 607 1,859 682 76
2007
Revenues ............................................................. $32,918 $27,347 $29,937 $28,043
Net earnings * ......................................................... 2,595 3,118 4,553 2,947
Net earnings per equivalent Class A common share ............................ 1,682 2,018 2,942 1,904
*Includes investment gains/losses and derivative gains/losses, which, for any given period have no predictive value and
variations in amount from period to period have no practical analytical value. Derivative gains/losses include significant
amounts related to non-cash fair value changes in the value of long-term contracts arising from short-term changes in equity
prices, interest rate and foreign currency rates, among other factors. After-tax investment and derivative gains/losses for the
periods presented above are as follows (in millions): 1st
Quarter
2nd
Quarter
3rd
Quarter
4th
Quarter
Investment and derivative gains/losses – 2008 .................................. $(991) $610 $(1,012) $(3,252)
Investment and derivative gains/losses – 2007 .................................. 382 608 1,992 597
61