Berkshire Hathaway 2008 Annual Report Download - page 31
Download and view the complete annual report
Please find page 31 of the 2008 Berkshire Hathaway annual report below. You can navigate through the pages in the report by either clicking on the pages listed below, or by using the keyword search tool below to find specific information within the annual report.-
 1
1 -
2
-
3
-
4
-
5
-
6
-
7
-
8
-
9
-
10
-
11
-
12
-
13
-
14
-
15
-
16
-
17
-
18
-
19
-
20
-
 21
21 -
 22
22 -
 23
23 -
 24
24 -
 25
25 -
 26
26 -
 27
27 -
 28
28 -
 29
29 -
 30
30 -
 31
31 -
 32
32 -
 33
33 -
 34
34 -
 35
35 -
 36
36 -
 37
37 -
 38
38 -
 39
39 -
 40
40 -
 41
41 -
42
-
43
-
44
-
45
-
46
-
47
-
48
-
49
-
50
-
51
-
52
-
53
-
54
-
55
-
56
-
57
-
58
-
59
-
60
-
61
-
62
-
63
-
64
-
65
-
66
-
67
-
68
-
69
-
70
-
71
-
72
-
73
-
74
-
75
-
76
-
77
-
78
-
79
-
80
-
81
-
82
-
83
-
84
-
85
-
86
-
87
-
88
-
89
-
90
-
91
-
92
-
93
-
94
-
95
-
96
-
97
-
98
-
99
-
100
 |
 |

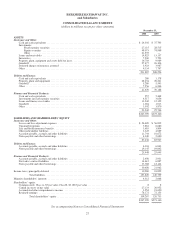
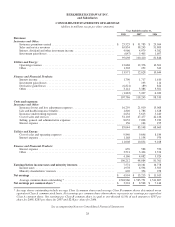
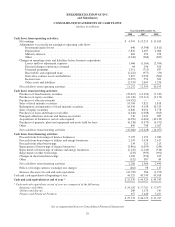
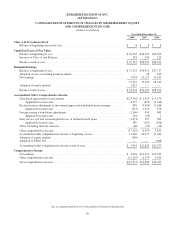
BERKSHIRE HATHAWAY INC.
and Subsidiaries
CONSOLIDATED STATEMENTS OF CASH FLOWS
(dollars in millions)
Year Ended December 31,
2008 2007 2006
Cash flows from operating activities:
Net earnings ............................................................. $ 4,994 $ 13,213 $ 11,015
Adjustments to reconcile net earnings to operating cash flows:
Investment (gains) losses ............................................... 640 (5,598) (1,811)
Depreciation ......................................................... 2,810 2,407 2,066
Minority interests ..................................................... 602 354 258
Other ............................................................... (1,248) (268) (627)
Changes in operating assets and liabilities before business acquisitions:
Losses and loss adjustment expenses ...................................... 1,466 (1,164) (2,704)
Deferred charges reinsurance assumed .................................... 64 196 424
Unearned premiums ................................................... 1,311 (713) 637
Receivables and originated loans ......................................... (2,222) (977) (59)
Derivative contract assets and liabilities ................................... 7,827 2,938 (563)
Income taxes ......................................................... (2,057) 553 303
Other assets and liabilities .............................................. (2,935) 1,609 1,256
Net cash flows from operating activities ....................................... 11,252 12,550 10,195
Cash flows from investing activities:
Purchases of fixed maturity securities ......................................... (35,615) (13,394) (7,747)
Purchases of equity securities ............................................... (10,140) (19,111) (9,173)
Purchases of other investments .............................................. (14,452) — —
Sales of fixed maturity securities ............................................. 14,796 7,821 1,818
Redemptions and maturities of fixed maturity securities ........................... 18,550 9,158 10,313
Sales of equity securities ................................................... 6,840 8,054 3,778
Purchases of loans and finance receivables ..................................... (1,446) (1,008) (365)
Principal collections on loans and finance receivables ............................ 740 1,229 985
Acquisitions of businesses, net of cash acquired ................................. (6,050) (1,602) (10,132)
Purchases of property, plant and equipment and assets held for lease ................ (6,138) (5,373) (4,571)
Other ................................................................... 849 798 1,017
Net cash flows from investing activities ....................................... (32,066) (13,428) (14,077)
Cash flows from financing activities:
Proceeds from borrowings of finance businesses ................................ 5,195 1,153 1,280
Proceeds from borrowings of utilities and energy businesses ....................... 2,147 3,538 2,417
Proceeds from other borrowings ............................................. 134 121 215
Repayments of borrowings of finance businesses ................................ (3,861) (1,093) (244)
Repayments of borrowings of utilities and energy businesses ....................... (2,147) (1,149) (516)
Repayments of other borrowings ............................................. (233) (995) (991)
Changes in short term borrowings ............................................ 1,183 (596) 245
Other ................................................................... (132) 387 84
Net cash flows from financing activities ....................................... 2,286 1,366 2,490
Effects of foreign currency exchange rate changes ............................... (262) 98 117
Increase (decrease) in cash and cash equivalents ................................. (18,790) 586 (1,275)
Cash and cash equivalents at beginning of year ...................................... 44,329 43,743 45,018
Cash and cash equivalents at end of year * ....................................... $25,539 $ 44,329 $ 43,743
* Cash and cash equivalents at end of year are comprised of the following:
Insurance and Other ....................................................... $ 24,302 $ 37,703 $ 37,977
Utilities and Energy ....................................................... 280 1,178 343
Finance and Financial Products ............................................. 957 5,448 5,423
$ 25,539 $ 44,329 $ 43,743
See accompanying Notes to Consolidated Financial Statements
29