Berkshire Hathaway 2008 Annual Report Download - page 72
Download and view the complete annual report
Please find page 72 of the 2008 Berkshire Hathaway annual report below. You can navigate through the pages in the report by either clicking on the pages listed below, or by using the keyword search tool below to find specific information within the annual report.-
 1
1 -
2
-
3
-
4
-
5
-
6
-
7
-
8
-
9
-
10
-
11
-
12
-
13
-
14
-
15
-
16
-
17
-
18
-
19
-
20
-
21
-
22
-
23
-
24
-
25
-
26
-
27
-
28
-
29
-
30
-
31
-
32
-
33
-
34
-
35
-
36
-
37
-
38
-
39
-
40
-
41
-
42
-
43
-
44
-
45
-
46
-
47
-
48
-
49
-
50
-
51
-
52
-
53
-
54
-
55
-
56
-
57
-
58
-
59
-
60
-
61
-
 62
62 -
 63
63 -
 64
64 -
 65
65 -
 66
66 -
 67
67 -
 68
68 -
 69
69 -
 70
70 -
 71
71 -
 72
72 -
 73
73 -
 74
74 -
 75
75 -
 76
76 -
 77
77 -
 78
78 -
 79
79 -
 80
80 -
 81
81 -
 82
82 -
83
-
84
-
85
-
86
-
87
-
88
-
89
-
90
-
91
-
92
-
93
-
94
-
95
-
96
-
97
-
98
-
99
-
100
 |
 |

Management’s Discussion (Continued)
Utilities and Energy (“MidAmerican”)
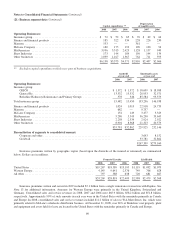
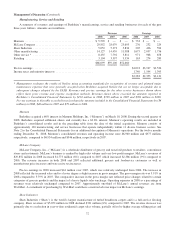
Revenues and earnings of MidAmerican for each of the past three years are summarized below. Amounts are in millions.
Revenues Earnings
2008 2007 2006 2008 2007 2006
MidAmerican Energy Company .......................... $ 4,742 $ 4,325 $ 3,519 $ 425 $ 412 $ 348
PacifiCorp ........................................... 4,558 4,319 2,971 703 692 356
Natural gas pipelines ................................... 1,221 1,088 972 595 473 376
U.K. utilities ......................................... 1,001 1,114 961 339 337 338
Real estate brokerage .................................. 1,147 1,511 1,724 (45) 42 74
Other ............................................... 1,302 271 497 1,278 130 245
$13,971 $12,628 $10,644
Earnings before corporate interest and taxes ................ 3,295 2,086 1,737
Interest, other than to Berkshire .......................... (332) (312) (261)
Interest on Berkshire junior debt .......................... (111) (108) (134)
Income taxes and minority interests ** ..................... (1,002) (477) (426)
Net earnings ...................................... $ 1,850 $ 1,189 $ 916
Earnings applicable to Berkshire * ........................ $ 1,704 $ 1,114 $ 885
Debt owed to others at December 31 ...................... 19,145 19,002 16,946
Debt owed to Berkshire at December 31 ................... 1,087 821 1,055
*Includes interest earned by Berkshire (net of related income taxes).
** Net of $58 million deferred income tax benefit in 2007 as a result of the reduction in the United Kingdom corporate income
tax rate from 30% to 28% which was enacted during the third quarter of 2007 and became effective in 2008.
Berkshire currently owns an 88.2% (87.4% diluted) interest in MidAmerican Energy Holdings Company
(“MidAmerican”), an international energy company. MidAmerican’s domestic regulated energy interests are comprised of two
regulated utility companies (MidAmerican Energy Company (“MEC”) and PacifiCorp) serving over 3 million retail customers
and two interstate natural gas pipeline companies (Northern Natural Gas and Kern River) with approximately 17,000 miles of
pipeline in operation and design capacity of about 7.0 billion cubic feet of natural gas per day. In the United Kingdom (“U.K.”),
electricity distribution subsidiaries serve about 3.8 million electricity end users. The rates that MidAmerican’s utilities,
electricity distribution and natural gas pipeline businesses may charge customers for energy and other services are generally
subject to regulatory approval. Rates are based in large part on the costs of business operations, including a return on capital. To
the extent these operations are not allowed to include such costs in the approved rates, operating results will be adversely
affected. In addition, MidAmerican’s other businesses include a diversified portfolio of independent power projects and the
second-largest residential real estate brokerage firm in the United States.
MEC’s revenues in 2008 increased $417 million (10%) over 2007. The increase reflects (1) increased regulated natural gas
revenues from cost based price increases that are largely passed on to customers, (2) increased non-regulated gas revenues due
primarily to higher prices and, to a lesser degree, increased volume and (3) increased wholesale regulated electricity revenues
driven by volume increases. Earnings before corporate interest and income taxes (“EBIT”) of MEC in 2008 increased $13
million (3%) versus 2007, resulting primarily from higher operating margins on wholesale regulated electricity and slightly
higher margins from regulated gas sales, partially offset by increased interest expense and lower miscellaneous income.
PacifiCorp’s revenues in 2008 increased $239 million (6%) over 2007. The increase was primarily related to higher retail
revenues due to regulator approved rate increases as well as increased customer growth and usage. PacifiCorp’s EBIT in 2008
increased $11 million (2%) versus 2007, as higher revenues were substantially offset by increased fuel costs and interest
expense.
70