Berkshire Hathaway 2008 Annual Report Download - page 64
Download and view the complete annual report
Please find page 64 of the 2008 Berkshire Hathaway annual report below. You can navigate through the pages in the report by either clicking on the pages listed below, or by using the keyword search tool below to find specific information within the annual report.-
 1
1 -
2
-
3
-
4
-
5
-
6
-
7
-
8
-
9
-
10
-
11
-
12
-
13
-
14
-
15
-
16
-
17
-
18
-
19
-
20
-
21
-
22
-
23
-
24
-
25
-
26
-
27
-
28
-
29
-
30
-
31
-
32
-
33
-
34
-
35
-
36
-
37
-
38
-
39
-
40
-
41
-
42
-
43
-
44
-
45
-
46
-
47
-
48
-
49
-
50
-
51
-
52
-
53
-
 54
54 -
 55
55 -
 56
56 -
 57
57 -
 58
58 -
 59
59 -
 60
60 -
 61
61 -
 62
62 -
 63
63 -
 64
64 -
 65
65 -
 66
66 -
 67
67 -
 68
68 -
 69
69 -
 70
70 -
 71
71 -
 72
72 -
 73
73 -
 74
74 -
75
-
76
-
77
-
78
-
79
-
80
-
81
-
82
-
83
-
84
-
85
-
86
-
87
-
88
-
89
-
90
-
91
-
92
-
93
-
94
-
95
-
96
-
97
-
98
-
99
-
100
 |
 |

BERKSHIRE HATHAWAY INC.
and Subsidiaries
Management’s Discussion and Analysis of
Financial Condition and Results of Operations
Results of Operations
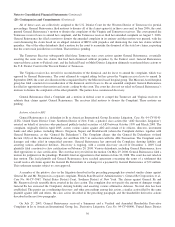
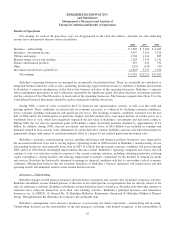
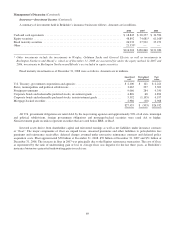
Net earnings for each of the past three years are disaggregated in the table that follows. Amounts are after deducting
income taxes and minority interests and are in millions.
2008 2007 2006
Insurance – underwriting ......................................................... $1,805 $ 2,184 $ 2,485
Insurance – investment income ..................................................... 3,497 3,510 3,120
Utilities and energy .............................................................. 1,704 1,114 885
Manufacturing, service and retailing ................................................ 2,283 2,353 2,131
Finance and financial products ..................................................... 479 632 732
Other ......................................................................... (129) (159) (47)
Investment and derivative gains/losses ............................................... (4,645) 3,579 1,709
Net earnings ............................................................... $4,994 $13,213 $11,015
Berkshire’s operating businesses are managed on an unusually decentralized basis. There are essentially no centralized or
integrated business functions (such as sales, marketing, purchasing, legal or human resources) and there is minimal involvement
by Berkshire’s corporate headquarters in the day-to-day business activities of the operating businesses. Berkshire’s corporate
office management participates in and is ultimately responsible for significant capital allocation decisions, investment activities
and the selection of the Chief Executive to head each of the operating businesses. The business segment data (Note 21 to the
Consolidated Financial Statements) should be read in conjunction with this discussion.
During 2008, a series of crises occurred in the U.S. financial and capital markets systems, as well as in the credit and
housing markets. These conditions accelerated into an economic recession, as evidenced by declining consumer confidence,
lower consumer spending, bankruptcies and significant job losses. The declining economic conditions worsened over the last
half of 2008 and in the fourth quarter in particular. Equity and debt markets have seen major declines in market prices on a
worldwide basis as well, which have negatively impacted the fair value of Berkshire’s investments and derivative contracts.
During 2008, the net after-tax unrealized gains in Berkshire’s equity investment portfolio declined by approximately $13.9
billion. In addition, during 2008, after-tax investment and derivative losses of $4.6 billion were included in earnings and
primarily related to non-cash fair value adjustments of certain derivative contract liabilities and non-cash other-than-temporary
impairment charges with respect to certain investments offset to a degree by net realized gains from investment sales.
Berkshire’s insurance, manufacturing, service, retailing and finance and financial products businesses were impacted by
the recession in different ways and to varying degrees. Operating results in 2008 for most of Berkshire’s manufacturing, service
and retailing businesses were generally lower than in 2007. It is likely that the current economic conditions will persist through
2009 and in to 2010 before meaningful improvements become evident. Berkshire’s operating companies have taken and will
continue to take cost reduction actions in response to the current economic situation, including curtailing production, reducing
capital expenditures, closing facilities and reducing employment to partially compensate for the declines in demand for goods
and services. Berkshire has historically attempted to manage its financial condition such that it can weather cyclical economic
conditions. Management believes that the economic franchises of Berkshire’s business operations will remain intact and that
operating results will ultimately return to more normal historical levels.
Insurance—Underwriting
Berkshire engages in both primary insurance and reinsurance of property and casualty risks. In primary insurance activities,
Berkshire subsidiaries assume defined portions of the risks of loss from persons or organizations that are directly subject to the
risks. In reinsurance activities, Berkshire subsidiaries assume defined portions of similar or dissimilar risks that other insurers or
reinsurers have subjected themselves to in their own insuring activities. Berkshire’s principal insurance and reinsurance
businesses are: (1) GEICO, (2) General Re, (3) Berkshire Hathaway Reinsurance Group and (4) Berkshire Hathaway Primary
Group. Through General Re, Berkshire also reinsures life and health risks.
Berkshire’s management views insurance businesses as possessing two distinct operations – underwriting and investing.
Underwriting decisions are the responsibility of the unit managers; investing, with limited exceptions, is the responsibility of
62