Berkshire Hathaway 2008 Annual Report Download - page 28
Download and view the complete annual report
Please find page 28 of the 2008 Berkshire Hathaway annual report below. You can navigate through the pages in the report by either clicking on the pages listed below, or by using the keyword search tool below to find specific information within the annual report.-
 1
1 -
2
-
3
-
4
-
5
-
6
-
7
-
8
-
9
-
10
-
11
-
12
-
13
-
14
-
15
-
16
-
17
-
 18
18 -
 19
19 -
 20
20 -
 21
21 -
 22
22 -
 23
23 -
 24
24 -
 25
25 -
 26
26 -
 27
27 -
 28
28 -
 29
29 -
 30
30 -
 31
31 -
 32
32 -
 33
33 -
 34
34 -
 35
35 -
 36
36 -
 37
37 -
 38
38 -
39
-
40
-
41
-
42
-
43
-
44
-
45
-
46
-
47
-
48
-
49
-
50
-
51
-
52
-
53
-
54
-
55
-
56
-
57
-
58
-
59
-
60
-
61
-
62
-
63
-
64
-
65
-
66
-
67
-
68
-
69
-
70
-
71
-
72
-
73
-
74
-
75
-
76
-
77
-
78
-
79
-
80
-
81
-
82
-
83
-
84
-
85
-
86
-
87
-
88
-
89
-
90
-
91
-
92
-
93
-
94
-
95
-
96
-
97
-
98
-
99
-
100
 |
 |

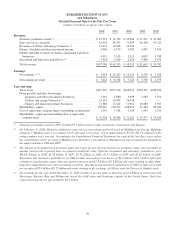
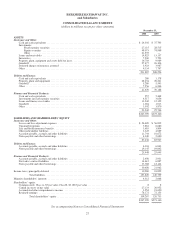
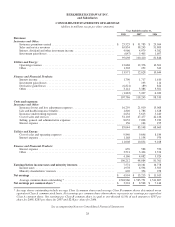
BERKSHIRE HATHAWAY INC.
and Subsidiaries
Selected Financial Data for the Past Five Years
(dollars in millions except per share data)
2008 2007 2006 2005 2004
Revenues:
Insurance premiums earned (1) ........................... $ 25,525 $ 31,783 $ 23,964 $ 21,997 $ 21,085
Sales and service revenues .............................. 65,854 58,243 51,803 46,138 43,222
Revenues of utilities and energy businesses (2) .............. 13,971 12,628 10,644 — —
Interest, dividend and other investment income ............. 4,966 4,979 4,382 3,487 2,816
Interest and other revenues of finance and financial products
businesses ......................................... 4,931 5,103 5,111 4,633 3,788
Investment and derivative gains/losses (3) .................. (7,461) 5,509 2,635 5,408 3,471
Total revenues ....................................... $107,786 $118,245 $ 98,539 $ 81,663 $ 74,382
Earnings:
Net earnings (3)(4) ..................................... $ 4,994 $ 13,213 $ 11,015 $ 8,528 $ 7,308
Net earnings per share ................................. $ 3,224 $ 8,548 $ 7,144 $ 5,538 $ 4,753
Year-end data:
Total assets .......................................... $267,399 $273,160 $248,437 $198,325 $188,874
Notes payable and other borrowings:
Insurance and other non-finance businesses ............ 4,349 2,680 3,698 3,583 3,450
Utilities and energy businesses (2) .................... 19,145 19,002 16,946 — —
Finance and financial products businesses .............. 13,388 12,144 11,961 10,868 5,387
Shareholders’ equity ................................... 109,267 120,733 108,419 91,484 85,900
Class A equivalent common shares outstanding, in thousands . . 1,549 1,548 1,543 1,541 1,539
Shareholders’ equity per outstanding Class A equivalent
common share ..................................... $ 70,530 $ 78,008 $ 70,281 $ 59,377 $ 55,824
(1) Insurance premiums earned in 2007 included $7.1 billion from a single reinsurance transaction with Equitas.
(2) On February 9, 2006, Berkshire Hathaway converted its non-voting preferred stock of MidAmerican Energy Holdings
Company (“MidAmerican”) to common stock and upon conversion, owned approximately 83.4% (80.5% diluted) of the
voting common stock interests. Accordingly, the Consolidated Financial Statements for each of the last three years reflect
the consolidation of the accounts of MidAmerican. Berkshire’s investment in MidAmerican was accounted for pursuant to
the equity method in 2004 and 2005.
(3) The amount of investment and derivative gains and losses for any given period has no predictive value, and variations in
amount from period to period have no practical analytical value. After-tax investment and derivative gains/losses were
$(4.65) billion in 2008, $3.58 billion in 2007, $1.71 billion in 2006, $3.53 billion in 2005 and $2.26 billion in 2004.
Investment and derivative gains/losses in 2008 include non-cash pre-tax losses of $5.0 billion ($3.25 billion after-tax)
relating to long duration equity index put option contracts and $1.8 billion ($1.2 billion after-tax) relating to other-than-
temporary impairments of certain investment securities. Investment and derivative gains/losses in 2005 include a non-cash
pre-tax gain of $5.0 billion ($3.25 billion after-tax) relating to the exchange of Gillette stock for Procter & Gamble stock.
(4) Net earnings for the year ended December 31, 2005 includes a pre-tax underwriting loss of $3.4 billion in connection with
Hurricanes Katrina, Rita and Wilma that struck the Gulf coast and Southeast regions of the United States. Such loss
reduced net earnings by approximately $2.2 billion.
26