Anthem Blue Cross 2002 Annual Report Download - page 89
Download and view the complete annual report
Please find page 89 of the 2002 Anthem Blue Cross annual report below. You can navigate through the pages in the report by either clicking on the pages listed below, or by using the keyword search tool below to find specific information within the annual report.-
 1
1 -
2
-
3
-
4
-
5
-
6
-
7
-
8
-
9
-
10
-
11
-
12
-
13
-
14
-
15
-
16
-
17
-
18
-
19
-
20
-
21
-
22
-
23
-
24
-
25
-
26
-
27
-
28
-
29
-
30
-
31
-
32
-
33
-
34
-
35
-
36
-
37
-
38
-
39
-
40
-
41
-
42
-
43
-
44
-
45
-
46
-
47
-
48
-
49
-
50
-
51
-
52
-
53
-
54
-
55
-
56
-
57
-
58
-
59
-
60
-
61
-
62
-
63
-
64
-
65
-
66
-
67
-
68
-
69
-
70
-
71
-
72
-
73
-
74
-
75
-
76
-
77
-
78
-
 79
79 -
 80
80 -
 81
81 -
 82
82 -
 83
83 -
 84
84 -
 85
85 -
 86
86 -
 87
87 -
 88
88 -
 89
89 -
 90
90 -
 91
91 -
 92
92 -
 93
93 -
 94
94
 |
 |

NOTES
to Consolidated Financial Statements (Continued)
84 Anthem, Inc. 2002 Annual Report
19. Statutory Information
Statutory-basis capital and surplus for Anthem Insurance was $2,260.7 and $2,338.7 at December 31, 2002 and
2001, respectively, and for the insurance subsidiaries of Anthem Southeast was $731.1 at December 31, 2002. Statutory-
basis net income of Anthem Insurance was $347.1, $406.9 and $91.7 for 2002, 2001 and 2000, respectively, and for the
insurance subsidiaries of Anthem Southeast was $191.8 for 2002. Statutory-basis capital and surplus of Anthem’s insur-
ance subsidiaries are subject to regulatory restrictions with respect to amounts available for dividends to Anthem.
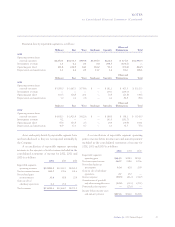
20. Selected Quarterly Financial Data (Unaudited)
Selected quarterly financial data is as follows:
For the Quarter Ended
March 31 June 30 September 30 December 31
2002
Total revenues $2,812.4 $2,900.1 $3,579.4 $3,990.4
Operating gain 106.6 118.6 193.5 225.8
Net income 99.8 106.2 171.2 171.9
Basic net income per share 0.97 1.03 1.33 1.22
Diluted net income per share 0.95 1.01 1.29 1.19
2001
Total revenues $ 2,560.5 $ 2,558.3 $ 2,663.7 $ 2,662.2
Operating gain 59.9 73.4 79.1 107.1
Net income 70.6 72.4 111.5 87.7
Pro forma basic earnings per share 0.68 0.70 1.08 0.85
Pro forma diluted earnings per share 0.68 0.70 1.07 0.85
Basic and diluted net income per share for the period
from November 2, 2001 (date of demutualization and
initial public offering) to December 31, 2001 — — — 0.54
There were no shares or dilutive securities outstanding prior to the demutualization and initial public offering. For
comparative pro forma earnings per share presentation, the weighted-average shares outstanding and the effect of dilu-
tive securities for the period from November 2, 2001 to December 31, 2001 was used to calculate pro forma earnings per
share for all 2001 periods presented.