Anthem Blue Cross 2002 Annual Report Download - page 40
Download and view the complete annual report
Please find page 40 of the 2002 Anthem Blue Cross annual report below. You can navigate through the pages in the report by either clicking on the pages listed below, or by using the keyword search tool below to find specific information within the annual report.-
 1
1 -
2
-
3
-
4
-
5
-
6
-
7
-
8
-
9
-
10
-
11
-
12
-
13
-
14
-
15
-
16
-
17
-
18
-
19
-
20
-
21
-
22
-
23
-
24
-
25
-
26
-
27
-
28
-
29
-
 30
30 -
 31
31 -
 32
32 -
 33
33 -
 34
34 -
 35
35 -
 36
36 -
 37
37 -
 38
38 -
 39
39 -
 40
40 -
 41
41 -
 42
42 -
 43
43 -
 44
44 -
 45
45 -
 46
46 -
 47
47 -
 48
48 -
 49
49 -
 50
50 -
51
-
52
-
53
-
54
-
55
-
56
-
57
-
58
-
59
-
60
-
61
-
62
-
63
-
64
-
65
-
66
-
67
-
68
-
69
-
70
-
71
-
72
-
73
-
74
-
75
-
76
-
77
-
78
-
79
-
80
-
81
-
82
-
83
-
84
-
85
-
86
-
87
-
88
-
89
-
90
-
91
-
92
-
93
-
94
 |
 |

MANAGEMENT’S DISCUSSION AND ANALYSIS
of Financial Condition and Results of Operations (Continued)
Anthem, Inc. 2002 Annual Report 35
the lowest co-payment, brand name drugs included in the
drug formulary have a higher co-payment and brand
name drugs omitted from the drug formulary have the
highest co-payment. Drug formularies are lists of prescrip-
tion drugs that have been reviewed and selected for their
quality and effectiveness by a committee of community-
based practicing physicians and clinical pharmacists.
Through our pharmacy benefit design, we encourage use
of these formulary listed brand name and generic drugs to
ensure members receive quality and cost-effective med-
ication. The favorable impact of three-tier drug programs
on prescription drug cost trends is most significant in the
first year of implementation. Excluding the impact of our
Trigon acquisition, we have already implemented three-
tier drug programs for approximately 66% of our members
as of December 31, 2002, as compared to approximately
60% of our members as of December 31, 2001.
Inpatient services costs increased approximately 9%
including the impact of our Trigon acquisition for the
entire rolling 12-month periods, including periods prior
to July 31, 2002. Excluding the impact of our Trigon
acquisition, our inpatient services trend was approx-
imately one percentage point lower. Approximately
two thirds of this trend resulted from unit cost increases
and approximately one third of this trend resulted from
utilization increases. The cost trend was primarily due to
a health care industry shift of lower-cost procedures to
outpatient settings, leaving more expensive procedures
performed in inpatient settings. In addition, growth in
inpatient trend was due to implementation of new
provider contracts that reflect the hospital industry’s
more aggressive stance in their contracting with health
benefit companies. Utilization increases resulted prima-
rily from increases in the frequency of inpatient surgeries.
We are implementing advanced care management pro-
grams and disease management programs which have
been proven to reduce deterioration in health and the
need for hospitalization. As a result of these programs,
hospital utilization has been essentially stable.
Administrative expense increased $520.5 million, or
26%, in 2002. On a same-store basis, administrative
expense increased $319.6 million, or 17%, primarily due
to higher salary cost and merit increases, other volume
sensitive costs such as higher commissions and premium
taxes and higher incentive compensation costs associated
with above targeted results. On a same-store basis, our
administrative expense ratio, calculated using operating
revenue and premium equivalents, remained consistent
with 2001 at 14.0%.
Net investment income increased $22.1 million, or
9%. This increase in investment income primarily
resulted from the investment of additional assets in 2002
from our Trigon acquisition, which was partially offset by
decreased average yield from investment securities. Also
contributing to the increase was the impact of an
increased allocation of fixed income securities as a per-
centage of our investment portfolio during the third quar-
ter of 2001. As yields on investment securities are
dependent on market interest rates and changes in inter-
est rates are unpredictable, there is no certainty that past
investment performance will be repeated in the future.
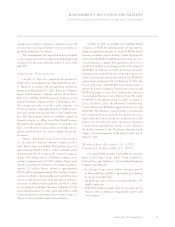
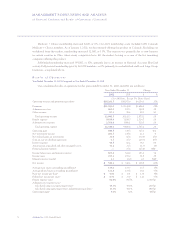
Net realized gains on investments decreased $30.4
million, or 50%. A summary is as follows:
Years Ended
December 31
2002 2001 $ Change % Change
($ in Millions)
Net realized gains
from the sale of
equity securities $ 0.6 $ 69.0 $(68.4) (99)%
Net realized gains
from the sale of
fixed maturity
securities 32.9 20.7 12.2 59%
Other than
temporary
impairments (3.1) (28.9) 25.8 89%
Net realized gains
on investments $30.4 $ 60.8 $(30.4) (50)%