Anthem Blue Cross 2002 Annual Report Download - page 32
Download and view the complete annual report
Please find page 32 of the 2002 Anthem Blue Cross annual report below. You can navigate through the pages in the report by either clicking on the pages listed below, or by using the keyword search tool below to find specific information within the annual report.-
 1
1 -
2
-
3
-
4
-
5
-
6
-
7
-
8
-
9
-
10
-
11
-
12
-
13
-
14
-
15
-
16
-
17
-
18
-
19
-
20
-
21
-
 22
22 -
 23
23 -
 24
24 -
 25
25 -
 26
26 -
 27
27 -
 28
28 -
 29
29 -
 30
30 -
 31
31 -
 32
32 -
 33
33 -
 34
34 -
 35
35 -
 36
36 -
 37
37 -
 38
38 -
 39
39 -
 40
40 -
 41
41 -
 42
42 -
43
-
44
-
45
-
46
-
47
-
48
-
49
-
50
-
51
-
52
-
53
-
54
-
55
-
56
-
57
-
58
-
59
-
60
-
61
-
62
-
63
-
64
-
65
-
66
-
67
-
68
-
69
-
70
-
71
-
72
-
73
-
74
-
75
-
76
-
77
-
78
-
79
-
80
-
81
-
82
-
83
-
84
-
85
-
86
-
87
-
88
-
89
-
90
-
91
-
92
-
93
-
94
 |
 |

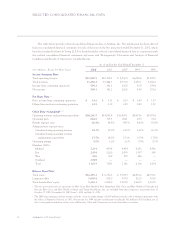
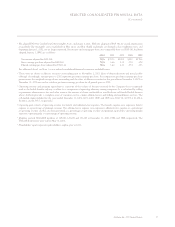
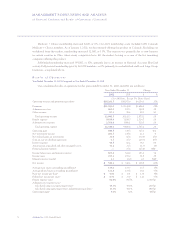
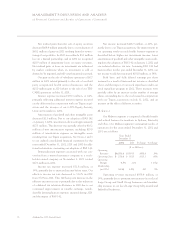
SELECTED CONSOLIDATED FINANCIAL DATA
(Continued)
Anthem, Inc. 2002 Annual Report 27
3We adopted FAS 142, Goodwill and Other Intangible Assets, on January 1, 2002. With the adoption of FAS 142, we ceased amortization
of goodwill. The intangible assets established for Blue Cross and Blue Shield trademarks are deemed to have indefinite lives, and
beginning January 1, 2002, are no longer amortized. Net income and earnings per share on a comparable basis as if FAS 142 had been
adopted January 1, 1998, are as follows:
2002 2001 2000 1999 1998
Net income adjusted for FAS 142 N/A $357.3 $238.5 $52.0 $179.2
Basic earnings per share adjusted for FAS 142 N/A 3.46 2.32 0.51 1.74
Diluted earnings per share adjusted for FAS 142 N/A 3.44 2.31 0.51 1.73
For additional detail, see Note 3 to our audited consolidated financial statements included herein.
4There were no shares or dilutive securities outstanding prior to November 2, 2001 (date of demutualization and initial public
offering). Accordingly, amounts prior to 2002 represent pro forma earnings per share. For comparative pro forma earnings per share
presentation, the weighted-average shares outstanding and the effect of dilutive securities for the period from November 2, 2001 to
December 31, 2001 was used to calculate pro forma earnings per share for all periods prior to 2002.
5Operating revenue and premium equivalents is a measure of the volume of business serviced by the Company that is commonly
used in the health benefits industry to allow for a comparison of operating efficiency among companies. It is calculated by adding
to premiums, administrative fees and other revenue the amount of claims attributable to non-Medicare, self-funded health business
where Anthem provides a complete array of customer service, claims administration and billing and enrollment services. The
self-funded claims included for the years ended December 31, 2002, 2001, 2000, 1999, and 1998 were $5,271.0, $3,937.1, $3,256.6,
$2,611.0, and $2,597.7, respectively.
6Operating gain consists of operating revenue less benefit and administrative expenses. The benefit expense ratio represents benefit
expense as a percentage of premium revenue. The administrative expense ratio represents administrative expense as a percentage
of operating revenue and has also been presented as a percentage of operating revenue and premium equivalents. Operating margin
represents operating gain as a percentage of operating revenue.
7Members exclude TRICARE members of 128,000, 129,000 and 153,000 at December 31, 2000, 1999, and 1998, respectively. The
TRICARE operations were sold on May 31, 2001.
8Shareholders’ equity represents policyholders’ surplus prior to 2001.