Anthem Blue Cross 2002 Annual Report Download - page 36
Download and view the complete annual report
Please find page 36 of the 2002 Anthem Blue Cross annual report below. You can navigate through the pages in the report by either clicking on the pages listed below, or by using the keyword search tool below to find specific information within the annual report.-
 1
1 -
2
-
3
-
4
-
5
-
6
-
7
-
8
-
9
-
10
-
11
-
12
-
13
-
14
-
15
-
16
-
17
-
18
-
19
-
20
-
21
-
22
-
23
-
24
-
25
-
 26
26 -
 27
27 -
 28
28 -
 29
29 -
 30
30 -
 31
31 -
 32
32 -
 33
33 -
 34
34 -
 35
35 -
 36
36 -
 37
37 -
 38
38 -
 39
39 -
 40
40 -
 41
41 -
 42
42 -
 43
43 -
 44
44 -
 45
45 -
 46
46 -
47
-
48
-
49
-
50
-
51
-
52
-
53
-
54
-
55
-
56
-
57
-
58
-
59
-
60
-
61
-
62
-
63
-
64
-
65
-
66
-
67
-
68
-
69
-
70
-
71
-
72
-
73
-
74
-
75
-
76
-
77
-
78
-
79
-
80
-
81
-
82
-
83
-
84
-
85
-
86
-
87
-
88
-
89
-
90
-
91
-
92
-
93
-
94
 |
 |

MANAGEMENT’S DISCUSSION AND ANALYSIS
of Financial Condition and Results of Operations (Continued)
Anthem, Inc. 2002 Annual Report 31
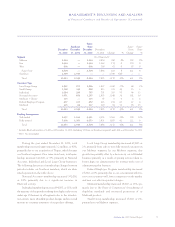
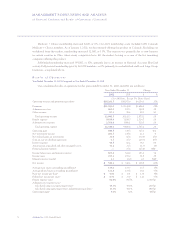
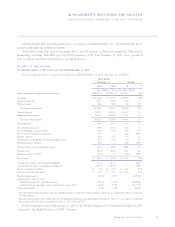
Same-
Southeast Store Same- Same-
December December December December Store Store
31, 2002 31, 2002 31, 2002 31, 2001 Change % Change %
Segment (In Thousands)
Midwest 5,234 — 5,234 4,854 380 8% 380 8%
East 2,434 — 2,434 2,260 174 8 174 8
West 836 — 836 769 67 9 67 9
Same-Store 8,504 — 8,504 7,883 621 8 621 8
Southeast 2,549 2,549 — — 2,549 NM2——
Total 11,053 2,549 8,504 7,883 3,170 40% 621 8%
Customer Type
Local Large Group 3,867 971 2,896 2,827 1,040 37% 69 2%
Small Group 1,168 340 828 813 355 44 15 2
Individual 1,084 289 795 701 383 55 94 13
National Accounts13,951 656 3,295 2,903 1,048 36 392 14
Medicare + Choice 103 — 103 97 6 6 6 6
Federal Employee Program 677 227 450 423 254 60 27 6
Medicaid 203 66 137 119 84 71 18 15
Total 11,053 2,549 8,504 7,883 3,170 40% 621 8%
Funding Arrangement
Self-funded 5,617 1,166 4,451 4,052 1,565 39% 399 10%
Fully-insured 5,436 1,383 4,053 3,831 1,605 42 222 6
Total 11,053 2,549 8,504 7,883 3,170 40% 621 8%
1Includes BlueCard members of 2,419 as of December 31, 2002 (including 325 from our Southeast segment) and 1,626 as of December 31, 2001.
2NM = Not meaningful.
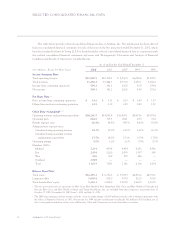
During the year ended December 31, 2002, total
membership increased approximately 3.2 million, or 40%,
primarily due to our acquisition of Trigon, which became
our Southeast segment. On a same-store basis, total mem-
bership increased 621,000, or 8%, primarily in National
Accounts, Individual and Local Large Group businesses.
The following discussion of membership changes between
periods excludes our Southeast members, which are iden-
tified separately in the table above.
National Accounts membership increased 392,000,
or 14%, primarily due to a significant increase in
BlueCard activity.
Individual membership increased 94,000, or 13%, with
the majority of this growth resulting from higher sales in our
under age 65 business in all segments due to the introduc-
tion of new, more affordable product designs and an overall
increase in consumer awareness of our product offerings.
Local Large Group membership increased 69,000, or
2%, primarily from sales to new fully-insured customers in
our Midwest segment. In our Midwest segment, this
growth was partially offset by a decrease in our self-funded
business primarily as a result of pricing actions taken to
better align our administrative fee revenue with costs of
administering this business.
Federal Employee Program membership increased
27,000, or 6%, primarily due to our concentrated effort to
serve our customers well, fewer competitors in the market
and new cost-effective product designs.
Medicaid membership increased 18,000, or 15%, pri-
marily due to the State of Connecticut’s broadening of
eligibility standards and increased promotion of its
Medicaid product.
Small Group membership increased 15,000, or 2%,
primarily in our Midwest segment.