Anthem Blue Cross 2002 Annual Report Download - page 49
Download and view the complete annual report
Please find page 49 of the 2002 Anthem Blue Cross annual report below. You can navigate through the pages in the report by either clicking on the pages listed below, or by using the keyword search tool below to find specific information within the annual report.-
 1
1 -
2
-
3
-
4
-
5
-
6
-
7
-
8
-
9
-
10
-
11
-
12
-
13
-
14
-
15
-
16
-
17
-
18
-
19
-
20
-
21
-
22
-
23
-
24
-
25
-
26
-
27
-
28
-
29
-
30
-
31
-
32
-
33
-
34
-
35
-
36
-
37
-
38
-
 39
39 -
 40
40 -
 41
41 -
 42
42 -
 43
43 -
 44
44 -
 45
45 -
 46
46 -
 47
47 -
 48
48 -
 49
49 -
 50
50 -
 51
51 -
 52
52 -
 53
53 -
 54
54 -
 55
55 -
 56
56 -
 57
57 -
 58
58 -
 59
59 -
60
-
61
-
62
-
63
-
64
-
65
-
66
-
67
-
68
-
69
-
70
-
71
-
72
-
73
-
74
-
75
-
76
-
77
-
78
-
79
-
80
-
81
-
82
-
83
-
84
-
85
-
86
-
87
-
88
-
89
-
90
-
91
-
92
-
93
-
94
 |
 |

MANAGEMENT’S DISCUSSION AND ANALYSIS
of Financial Condition and Results of Operations (Continued)
44 Anthem, Inc. 2002 Annual Report
Amortization of goodwill and other intangible assets
increased $4.4 million, or 16%, primarily due to amortiza-
tion expense associated with our acquisition of BCBS-
ME. As we adopted FAS 142 on January 1, 2002, this
standard did not have any effect on these results. See
Notes 1, 2 and 3 to our audited consolidated financial
statements for the years ended December 31, 2002, 2001
and 2000 for additional information concerning our
adoption of FAS 142.
Demutualization expenses associated with our
conversion from a mutual insurance company to a
stockholder-owned company on November 2, 2001
totaled $27.6 million in 2001.
Income tax expense increased $81.2 million, or 79%,
primarily due to higher income before taxes. Our effective
income tax rate in 2001 was 35.0% and was 31.0% in
2000. Our rate was lower than the statutory effective tax
rate in 2000 primarily as a result of changes in our deferred
tax valuation allowance. Our effective tax rate increased in
2001 primarily due to the non-deductibility of demutual-
ization expenses and a portion of goodwill amortization for
income tax purposes.
Net income increased $116.2 million, or 51%, prima-
rily due to the improvement in our operating results, net
realized capital gains, gain on sale of subsidiary operations
and higher investment income. Excluding the gain on the
sale of our TRICARE business ($16.3 million after tax),
net realized gains on investments and demutualization
expenses, net income increased $105.0 million, or 51%.
Both basic and fully diluted earnings per share
increased as a result of increased net income as described
above. December 31, 2001 and 2000 amounts represent
pro forma earnings per share, which includes earnings
prior to our initial public offering. See Note 11 to our
audited consolidated financial statements for the years
ended December 31, 2002, 2001 and 2000.
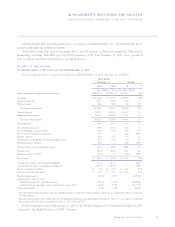
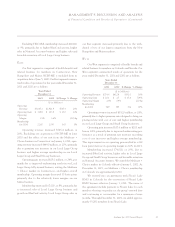
Midwest
Our Midwest segment is comprised of health benefit
and related business for members in Indiana, Kentucky
and Ohio. Our Midwest segment’s summarized results of
operations for the years ended December 31, 2001 and
2000 are as follows:
Years Ended
December 31
2001 2000 $ Change % Change
($ in Millions)
Operating
Revenue $5,093.0 $4,460.5 $632.5 14%
Operating Gain $ 161.5 $ 87.8 $ 73.7 84%
Operating
Margin 3.2% 2.0% 120 bp
Membership
(in 000s) 4,854 4,4541400 9%
1Excludes 128,000 TRICARE members.
Operating revenue increased $632.5 million, or 14%,
due primarily to premium rate increases in our Local Large
Group and Small Group businesses and the effect of higher
average membership in our Medicare + Choice business.
Operating gain increased $73.7 million, or 84%,
resulting in an operating margin of 3.2% at December 31,
2001, a 120 basis point improvement from the year ended
December 31, 2000. This improvement was primarily
due to revenue growth and effective expense control.
Administrative expense increased at a slower rate than
premiums as we gained operating efficiencies and lever-
aged our fixed costs over higher membership.
Our Midwest segment assumed a portion of the risk for
Anthem Alliance’s TRICARE contract until December 31,
2000. Effective January 1, 2001, Anthem Alliance reas-
sumed this risk. For the year ended December 31, 2000,
our Midwest segment received $122.1 million of premium
income, no administrative fees or other income, incurred
$113.8 million of benefit expense and $7.4 million of
administrative expense, resulting in a $0.9 million operat-
ing gain on the TRICARE contract. We also had 128,000
TRICARE members included in our Midwest segment’s
membership at December 31, 2000, and no members at
December 31, 2001.