Anthem Blue Cross 2002 Annual Report Download - page 42
Download and view the complete annual report
Please find page 42 of the 2002 Anthem Blue Cross annual report below. You can navigate through the pages in the report by either clicking on the pages listed below, or by using the keyword search tool below to find specific information within the annual report.-
 1
1 -
2
-
3
-
4
-
5
-
6
-
7
-
8
-
9
-
10
-
11
-
12
-
13
-
14
-
15
-
16
-
17
-
18
-
19
-
20
-
21
-
22
-
23
-
24
-
25
-
26
-
27
-
28
-
29
-
30
-
31
-
 32
32 -
 33
33 -
 34
34 -
 35
35 -
 36
36 -
 37
37 -
 38
38 -
 39
39 -
 40
40 -
 41
41 -
 42
42 -
 43
43 -
 44
44 -
 45
45 -
 46
46 -
 47
47 -
 48
48 -
 49
49 -
 50
50 -
 51
51 -
 52
52 -
53
-
54
-
55
-
56
-
57
-
58
-
59
-
60
-
61
-
62
-
63
-
64
-
65
-
66
-
67
-
68
-
69
-
70
-
71
-
72
-
73
-
74
-
75
-
76
-
77
-
78
-
79
-
80
-
81
-
82
-
83
-
84
-
85
-
86
-
87
-
88
-
89
-
90
-
91
-
92
-
93
-
94
 |
 |

MANAGEMENT’S DISCUSSION AND ANALYSIS
of Financial Condition and Results of Operations (Continued)
Anthem, Inc. 2002 Annual Report 37
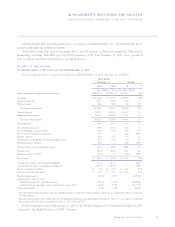
Operating gain increased $110.1 million, or 68%,
primarily due to improved underwriting results in our
Local Large Group fully-insured and Small Group busi-
nesses. Our operating gain was also impacted by the
recognition of a $15.7 million favorable adjustment for
prior year reserve releases recognized in the third quarter
of 2002 and an $11.2 million strengthening of reserves
during the third quarter of 2001. Operating gain improve-
ments were partially offset by a $23.0 million unfavorable
adjustment recorded during the third quarter of 2002 to
reflect the accrual of additional premium taxes in the
state of Ohio.
Membership increased 380,000, or 8%, primarily due
to additional BlueCard activity and enrollment gains in
our Local Large Group fully-insured and Individual busi-
nesses. Individual sales benefited from the introduction of
new, lower premium products. Our Midwest segment
experienced a decrease in Local Large Group self-funded
membership, which was anticipated and was a result of
pricing actions designed to better align revenue with costs
of services to this membership class.
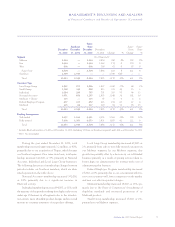
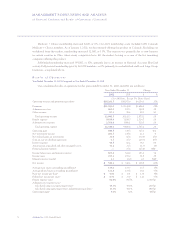
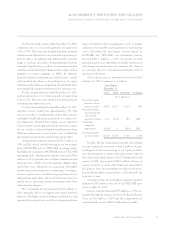
East
Our East segment is comprised of health benefit and
related business for members in Connecticut, New
Hampshire and Maine. Our East segment’s summarized
results of operations for the years ended December 31,
2002 and 2001 are as follows:
Years Ended
December 31
2002 2001 $ Change % Change
($ in Millions)
Operating
Revenue $4,151.5 $3,667.3 $484.2 13%
Operating Gain $ 222.9 $ 128.8 $ 94.1 73%
Operating
Margin 5.4% 3.5% 190 bp
Membership
(in 000s) 2,434 2,260 174 8%
Operating revenue increased $484.2 million, or
13%, primarily due to premium rate increases, particularly
in our Local Large Group and Small Group businesses.
Operating gain increased $94.1 million, or 73%,
primarily due to improved underwriting results, particu-
larly in our Individual and Local Large Group businesses,
and an unfavorable reserve strengthening adjustment of
$9.4 million recorded during the third quarter of 2001.
Membership increased 174,000, or 8%, primarily due
to increased BlueCard activity and enrollment gains in
our Local Large Group self-funded business. Our growth
in Local Large Group self-funded business primarily
resulted from changes in our Local Large Group mix of
business from fully-insured to self-funded.
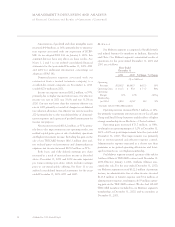
On February 28, 2002, a subsidiary of Anthem
Insurance, Anthem Health Plans of Maine, Inc., com-
pleted its purchase of the remaining 50% ownership
interest in Maine Partners Health Plan, Inc. for an aggre-
gate purchase price of $10.6 million. We had previously
consolidated the financial results of this entity in our
consolidated financial statements and recorded minority
interest for the percentage we did not own.
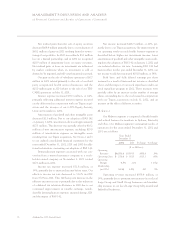
West
Our West segment is comprised of health benefit and
related business for members in Colorado and Nevada. Our
West segment’s summarized results of operations for the
years ended December 31, 2002 and 2001 are as follows:
Years Ended
December 31
2002 2001 $ Change % Change
($ in Millions)
Operating Revenue $920.1 $774.4 $145.7 19%
Operating Gain $ 74.7 $ 20.1 $ 54.6 272%
Operating Margin 8.1% 2.6% 550 bp
Membership
(in 000s) 836 769 67 9%
Operating revenue increased by $145.7 million, or
19%, primarily due to higher premium rates particularly in
our Local Large Group fully-insured and Small Group busi-
nesses, and higher membership in our Individual business.