Anthem Blue Cross 2002 Annual Report Download - page 31
Download and view the complete annual report
Please find page 31 of the 2002 Anthem Blue Cross annual report below. You can navigate through the pages in the report by either clicking on the pages listed below, or by using the keyword search tool below to find specific information within the annual report.-
 1
1 -
2
-
3
-
4
-
5
-
6
-
7
-
8
-
9
-
10
-
11
-
12
-
13
-
14
-
15
-
16
-
17
-
18
-
19
-
20
-
 21
21 -
 22
22 -
 23
23 -
 24
24 -
 25
25 -
 26
26 -
 27
27 -
 28
28 -
 29
29 -
 30
30 -
 31
31 -
 32
32 -
 33
33 -
 34
34 -
 35
35 -
 36
36 -
 37
37 -
 38
38 -
 39
39 -
 40
40 -
 41
41 -
42
-
43
-
44
-
45
-
46
-
47
-
48
-
49
-
50
-
51
-
52
-
53
-
54
-
55
-
56
-
57
-
58
-
59
-
60
-
61
-
62
-
63
-
64
-
65
-
66
-
67
-
68
-
69
-
70
-
71
-
72
-
73
-
74
-
75
-
76
-
77
-
78
-
79
-
80
-
81
-
82
-
83
-
84
-
85
-
86
-
87
-
88
-
89
-
90
-
91
-
92
-
93
-
94
 |
 |

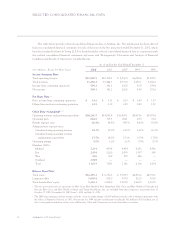
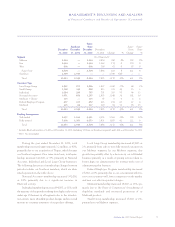
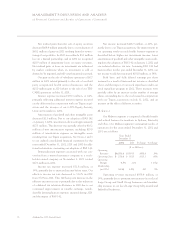
SELECTED CONSOLIDATED FINANCIAL DATA
26 Anthem, Inc. 2002 Annual Report
The table below provides selected consolidated financial data of Anthem, Inc. The information has been derived
from our consolidated financial statements for each of the years in the five year period ended December 31, 2002, which
have been audited by Ernst & Young LLP. You should read this selected consolidated financial data in conjunction with
the audited consolidated financial statements and notes and “Management’s Discussion and Analysis of Financial
Condition and Results of Operations” included herein.
As of and for the Year Ended December 31
($ in Millions, Except Per Share Data) 200212001 2000119991, 2 1998
Income Statement Data3
Total operating revenue $12,990.5 $10,120.3 $ 8,543.5 $6,080.6 $5,389.7
Total revenues 13,282.3 10,444.7 8,771.0 6,270.1 5,682.4
Income from continuing operations 549.1 342.2 226.0 50.9 178.4
Net income 549.1 342.2 226.0 44.9 172.4
Per Share Data3, 4
Basic income from continuing operations $ 4.61 $ 3.31 $ 2.19 $ 0.49 $ 1.73
Diluted income from continuing operations 4.51 3.30 2.18 0.49 1.72
Other Data—(unaudited)5, 6, 7
Operating revenue and premium equivalents $18,261.5 $14,057.4 $11,800.1 $8,691.6 $7,987.4
Operating gain 644.5 319.5 184.1 28.5 35.4
Benefit expense ratio 82.4% 84.5% 84.7% 84.6% 83.0%
Administrative expense ratio:
Calculated using operating revenue 19.3% 19.6% 21.2% 24.2% 26.3%
Calculated using operating revenue
and premium equivalents 13.7% 14.1% 15.3% 16.9% 17.8%
Operating margin 5.0% 3.2% 2.2% 0.5% 0.7%
Members (000s)
Midwest 5,234 4,854 4,454 4,253 4,046
East 2,434 2,260 2,093 1,397 968
West 836 769 595 486 —
Southeast 2,549 ————
Total 11,053 7,883 7,142 6,136 5,014
Balance Sheet Data8
Total assets $12,293.1 $ 6,276.6 $ 5,708.5 $4,816.2 $4,359.2
Long term debt 1,659.4 818.0 597.5 522.0 301.9
Total shareholders’ equity 5,362.3 2,060.0 1,919.8 1,660.9 1,702.5
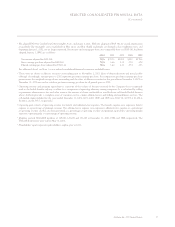
1The net assets and results of operations for Blue Cross Blue Shield of New Hampshire, Blue Cross and Blue Shield of Colorado and
Nevada, Blue Cross and Blue Shield of Maine and Trigon Healthcare, Inc. are included from their respective acquisition dates of
October 27, 1999, November 16, 1999, June 5, 2000 and July 31, 2002.
2The 1999 operating gain and net income includes a non-recurring charge of $41.9 million related to the settlement agreement with
the Office of Inspector General, or OIG. Net income for 1999 includes contributions totaling $114.1 million ($71.8 million, net of
tax) to non-profit foundations in the states of Kentucky, Ohio and Connecticut to settle charitable asset claims.