Anthem Blue Cross 2002 Annual Report Download - page 4
Download and view the complete annual report
Please find page 4 of the 2002 Anthem Blue Cross annual report below. You can navigate through the pages in the report by either clicking on the pages listed below, or by using the keyword search tool below to find specific information within the annual report.-
 1
1 -
 2
2 -
 3
3 -
 4
4 -
 5
5 -
 6
6 -
 7
7 -
 8
8 -
 9
9 -
 10
10 -
 11
11 -
 12
12 -
 13
13 -
 14
14 -
 15
15 -
16
-
17
-
18
-
19
-
20
-
21
-
22
-
23
-
24
-
25
-
26
-
27
-
28
-
29
-
30
-
31
-
32
-
33
-
34
-
35
-
36
-
37
-
38
-
39
-
40
-
41
-
42
-
43
-
44
-
45
-
46
-
47
-
48
-
49
-
50
-
51
-
52
-
53
-
54
-
55
-
56
-
57
-
58
-
59
-
60
-
61
-
62
-
63
-
64
-
65
-
66
-
67
-
68
-
69
-
70
-
71
-
72
-
73
-
74
-
75
-
76
-
77
-
78
-
79
-
80
-
81
-
82
-
83
-
84
-
85
-
86
-
87
-
88
-
89
-
90
-
91
-
92
-
93
-
94
 |
 |
%%
Change Change
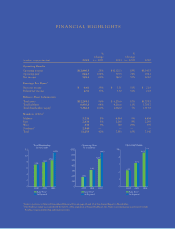
(in millions, except per share data) 2002 vs. 2001 2001 vs. 2000 2000
Operating Results
Operating revenue $12,990.5 28% $10,120.3 18% $8,543.5
Operating gain1644.5 102% 319.5 74% 184.1
Net income 549.1 60% 342.2 51% 226.0
Earnings Per Share1
Basic net income $4.61 39% $ 3.31 51% $ 2.19
Diluted net income 4.51 37% 3.30 51% 2.18
Balance Sheet Information
Total assets $12,293.1 96% $ 6,276.6 10% $5,708.5
Total liabilities 6,930.8 64% 4,216.6 11% 3,788.7
Total shareholders’ equity15,362.3 160% 2,060.0 7% 1,919.8
Members (000s)1
Midwest 5,234 8% 4,854 9% 4,454
East 2,434 8% 2,260 8% 2,093
West 836 9% 769 29% 595
Southeast22,549 ————
Total 11,053 40% 7,883 10% 7,142
FINANCIAL HIGHLIGHTS
0
2
4
6
8
10
12
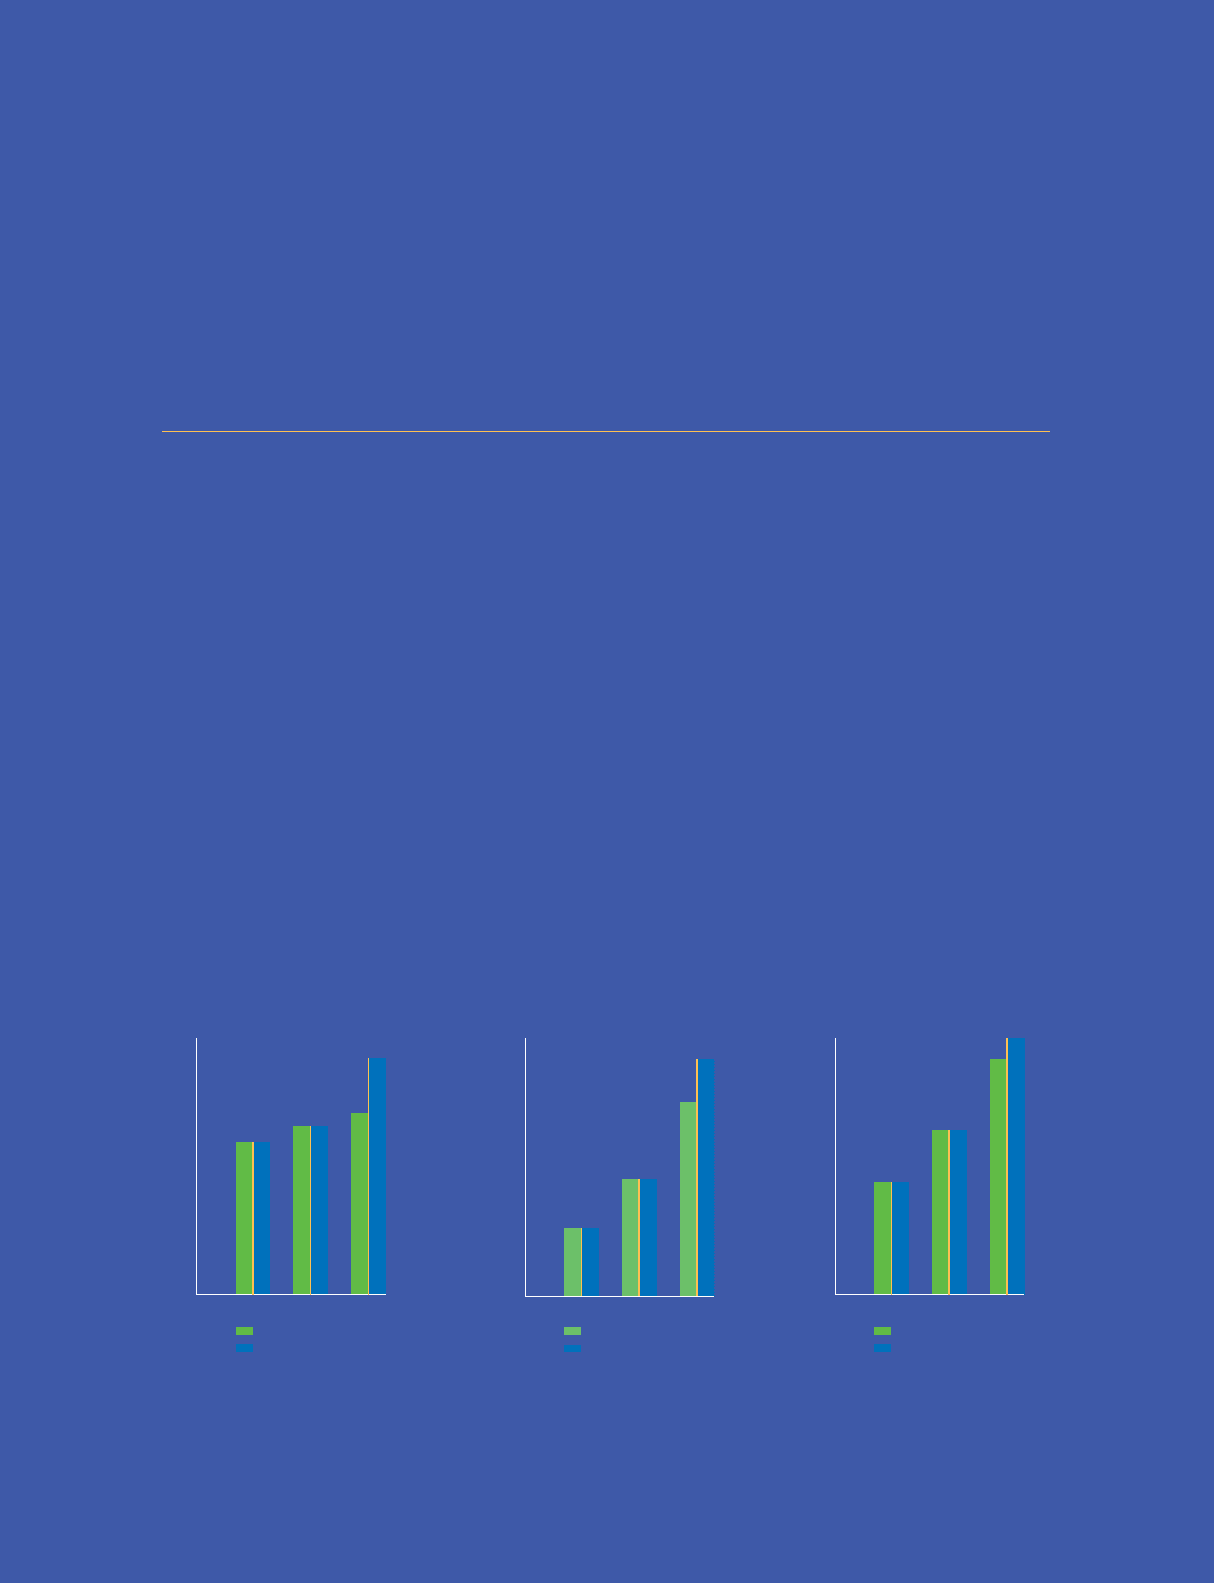
8,504
11,053
7,883
7,142
2000 2001 2002
Same Store2
As Reported
To ta l Membership
(in thousands)
0
100
200
300
400
500
600
$700
2000 2001 2002
Same Store2
As Reported
Operating Gain
($ in millions)
644.5
528.5
319.5
184.1
02000 2001 2002
1
2
3
4
5%
4.6%
3.2%
2.2%
5.0%
Same Store2
As Reported
Operating Margin
1Refer to footnotes to Selected Consolidated Financial Data on pages 26 and 27 of this Annual Report to Shareholders.
2The Southeast region was formed with the July 31, 2002 acquisition of Trigon Healthcare, Inc. Same-store information as presented excludes
Southeast region membership and financial results.