Anthem Blue Cross 2002 Annual Report Download - page 82
Download and view the complete annual report
Please find page 82 of the 2002 Anthem Blue Cross annual report below. You can navigate through the pages in the report by either clicking on the pages listed below, or by using the keyword search tool below to find specific information within the annual report.-
 1
1 -
2
-
3
-
4
-
5
-
6
-
7
-
8
-
9
-
10
-
11
-
12
-
13
-
14
-
15
-
16
-
17
-
18
-
19
-
20
-
21
-
22
-
23
-
24
-
25
-
26
-
27
-
28
-
29
-
30
-
31
-
32
-
33
-
34
-
35
-
36
-
37
-
38
-
39
-
40
-
41
-
42
-
43
-
44
-
45
-
46
-
47
-
48
-
49
-
50
-
51
-
52
-
53
-
54
-
55
-
56
-
57
-
58
-
59
-
60
-
61
-
62
-
63
-
64
-
65
-
66
-
67
-
68
-
69
-
70
-
71
-
 72
72 -
 73
73 -
 74
74 -
 75
75 -
 76
76 -
 77
77 -
 78
78 -
 79
79 -
 80
80 -
 81
81 -
 82
82 -
 83
83 -
 84
84 -
 85
85 -
 86
86 -
 87
87 -
 88
88 -
 89
89 -
 90
90 -
 91
91 -
 92
92 -
93
-
94
 |
 |

NOTES
to Consolidated Financial Statements (Continued)
Anthem, Inc. 2002 Annual Report 77
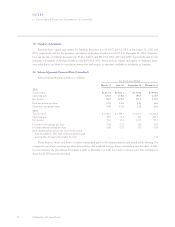
The reconciliation of the funded status to the net benefit cost accrued is as follows:
Pension Benefits Other Benefits
2002 2001 2002 2001
Funded status $ (66.2) $(87.6) $(175.8) $(120.6)
Unrecognized net loss (gain) 250.6 103.2 0.7 (5.1)
Unrecognized prior service cost (20.4) (25.3) (25.5) (33.6)
Additional minimum liability (18.2) (6.5) ——
Prepaid (accrued) benefit cost at September 30 145.8 (16.2) (200.6) (159.3)
Payments made after the measurement date 0.4 76.7 3.8 2.7
Prepaid (accrued) benefit cost at December 31 $146.2 $ 60.5 $(196.8) $(156.6)
The weighted-average assumptions used in calculating the accrued liabilities for all plans are as follows:
Pension Benefits Other Benefits
2002 2001 2000 2002 2001 2000
Discount rate 6.75% 7.25% 7.50% 6.75% 7.25% 7.50%
Rate of compensation increase 4.50 4.50 4.50 4.50 4.50 4.50
Expected rate of return on plan assets 8.50 9.00 9.00 6.50 6.50 6.27
The assumed health care cost trend rate used in measuring the other benefit obligations is generally 10% in 2002,
decreasing 1% per year to 5% in 2007.
The health care cost trend rate assumption can have a significant effect on the amounts reported. A one-percentage-
point change in assumed health care cost trend rates would have the following effects:
1-Percentage 1-Percentage
Point Increase Point Decrease
Effect on total of service and interest cost components $ 1.5 $ (1.2)
Effect on the accumulated postretirement benefit obligation 17.8 (14.5)
The components of net periodic benefit cost (credit) are as follows:
Pension Benefits Other Benefits
2002 2001 2000 2002 2001 2000
Service cost $ 35.0 $ 29.3 $ 27.3 $ 1.7 $ 1.5 $ 1.3
Interest cost 45.8 40.9 36.6 11.7 8.7 8.4
Expected return on assets (63.2) (55.1) (49.9) (2.0) (1.8) (1.4)
Recognized actuarial loss (gain) 0.6 0.3 2.8 —(1.7) (1.7)
Amortization of prior service cost (3.9) (3.9) (3.3) (6.6) (6.8) (6.5)
Amortization of transition asset —(1.0) (1.7) ———
Net periodic benefit cost (credit) $ 14.3 $ 10.5 $ 11.8 $ 4.8 $(0.1) $ 0.1
The Company has several qualified defined contribution plans covering substantially all employees. Eligible
employees may only participate in one plan. Voluntary employee contributions are matched at the rate of 50%, up to a
maximum depending upon the plan, subject to certain limitations. Contributions made by the Company totaled $14.3,
$11.2 and $10.3 during 2002, 2001 and 2000, respectively.