Anthem Blue Cross 2002 Annual Report Download - page 88
Download and view the complete annual report
Please find page 88 of the 2002 Anthem Blue Cross annual report below. You can navigate through the pages in the report by either clicking on the pages listed below, or by using the keyword search tool below to find specific information within the annual report.-
 1
1 -
2
-
3
-
4
-
5
-
6
-
7
-
8
-
9
-
10
-
11
-
12
-
13
-
14
-
15
-
16
-
17
-
18
-
19
-
20
-
21
-
22
-
23
-
24
-
25
-
26
-
27
-
28
-
29
-
30
-
31
-
32
-
33
-
34
-
35
-
36
-
37
-
38
-
39
-
40
-
41
-
42
-
43
-
44
-
45
-
46
-
47
-
48
-
49
-
50
-
51
-
52
-
53
-
54
-
55
-
56
-
57
-
58
-
59
-
60
-
61
-
62
-
63
-
64
-
65
-
66
-
67
-
68
-
69
-
70
-
71
-
72
-
73
-
74
-
75
-
76
-
77
-
 78
78 -
 79
79 -
 80
80 -
 81
81 -
 82
82 -
 83
83 -
 84
84 -
 85
85 -
 86
86 -
 87
87 -
 88
88 -
 89
89 -
 90
90 -
 91
91 -
 92
92 -
 93
93 -
 94
94
 |
 |

NOTES
to Consolidated Financial Statements (Continued)
Anthem, Inc. 2002 Annual Report 83
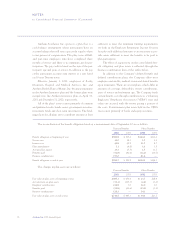
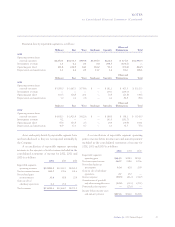
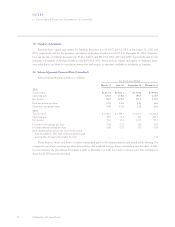
Financial data by reportable segment is as follows:
Other and
Midwest East West Southeast Specialty Eliminations Total
2002
Operating revenue from
external customers $6,050.1 $4,151.3 $919.8 $1,467.5 $224.0 $ 177.8 $12,990.5
Intersegment revenues 1.3 0.2 0.3 0.4 299.5 (301.7) —
Operating gain (loss) 271.6 222.9 74.7 116.0 50.7 (91.4) 644.5
Depreciation and amortization 1.1 2.2 0.5 13.7 3.4 87.2 108.1
Other and
Midwest East West Southeast Specialty Eliminations Total
2001
Operating revenue from
external customers $ 5,093.0 $ 3,667.3 $ 774.4 $ — $ 182.1 $ 403.5 $ 10,120.3
Intersegment revenues — — — — 214.0 (214.0) —
Operating gain (loss) 161.5 128.8 20.1 — 32.9 (23.8) 319.5
Depreciation and amortization 1.0 2.4 2.8 — 2.6 80.8 89.6
Other and
Midwest East West Southeast Specialty Eliminations Total
2000
Operating revenue from
external customers $ 4,452.3 $ 2,921.9 $ 622.4 $ — $ 188.8 $ 358.1 $ 8,543.5
Intersegment revenues 8.2 — — — 143.5 (151.7) —
Operating gain (loss) 87.8 103.8 2.5 — 24.9 (34.9) 184.1
Depreciation and amortization 16.9 17.1 8.7 — 2.1 30.5 75.3
Asset and equity details by reportable segment have
not been disclosed, as they are not reported internally by
the Company.
A reconciliation of reportable segment operating
revenues to the amounts of total revenues included in the
consolidated statements of income for 2002, 2001 and
2000 is as follows:
2002 2001 2000
Reportable segments
operating revenues $12,990.5 $10,120.3 $8,543.5
Net investment income 260.7 238.6 201.6
Net realized gains
on investments 30.4 60.8 25.9
Gain on sale of
subsidiary operations 0.7 25.0 —
Total revenues $13,282.3 $10,444.7 $8,771.0
A reconciliation of reportable segment operating
gain to income before income taxes and minority interest
included in the consolidated statements of income for
2002, 2001 and 2000 is as follows:
2002 2001 2000
Reportable segments
operating gain $644.5 $319.5 $184.1
Net investment income 260.7 238.6 201.6
Net realized gains on
investments 30.4 60.8 25.9
Gain on sale of subsidiary
operations 0.7 25.0 —
Interest expense (98.5) (60.2) (54.7)
Amortization of goodwill
and other intangible assets (30.2) (31.5) (27.1)
Demutualization expenses —(27.6) —
Income before income taxes
and minority interest $807.6 $524.6 $329.8