Anthem Blue Cross 2002 Annual Report Download - page 71
Download and view the complete annual report
Please find page 71 of the 2002 Anthem Blue Cross annual report below. You can navigate through the pages in the report by either clicking on the pages listed below, or by using the keyword search tool below to find specific information within the annual report.-
 1
1 -
2
-
3
-
4
-
5
-
6
-
7
-
8
-
9
-
10
-
11
-
12
-
13
-
14
-
15
-
16
-
17
-
18
-
19
-
20
-
21
-
22
-
23
-
24
-
25
-
26
-
27
-
28
-
29
-
30
-
31
-
32
-
33
-
34
-
35
-
36
-
37
-
38
-
39
-
40
-
41
-
42
-
43
-
44
-
45
-
46
-
47
-
48
-
49
-
50
-
51
-
52
-
53
-
54
-
55
-
56
-
57
-
58
-
59
-
60
-
 61
61 -
 62
62 -
 63
63 -
 64
64 -
 65
65 -
 66
66 -
 67
67 -
 68
68 -
 69
69 -
 70
70 -
 71
71 -
 72
72 -
 73
73 -
 74
74 -
 75
75 -
 76
76 -
 77
77 -
 78
78 -
 79
79 -
 80
80 -
 81
81 -
82
-
83
-
84
-
85
-
86
-
87
-
88
-
89
-
90
-
91
-
92
-
93
-
94
 |
 |

NOTES
to Consolidated Financial Statements (Continued)
66 Anthem, Inc. 2002 Annual Report
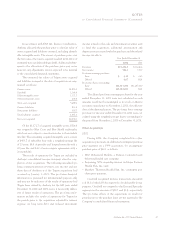
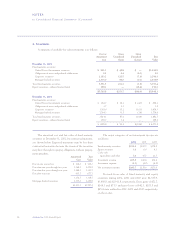
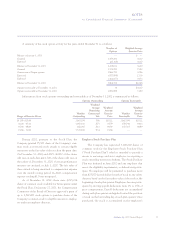
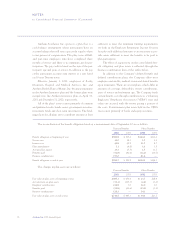
4. Investments
A summary of available-for-sale investments is as follows:
Cost or Gross Gross
Amortized Unrealized Unrealized Fair
Cost Gains (Losses) Value
December 31, 2002
Fixed maturity securities:
United States Government securities $ 991.1 $ 48.8 $ — $1,039.9
Obligations of states and political subdivisions 2.2 0.4 (0.1) 2.5
Corporate securities 2,183.2 120.5 (7.6) 2,296.1
Mortgage-backed securities 2,375.0 84.0 (0.1) 2,458.9
Total fixed maturity securities 5,551.5 253.7 (7.8) 5,797.4
Equity securities—indexed mutual funds 189.3 — (38.6) 150.7
$5,740.8 $253.7 $(46.4) $5,948.1
December 31, 2001
Fixed maturity securities:
United States Government securities $ 684.7 $ 18.2 $ (4.7) $ 698.2
Obligations of states and political subdivisions 3.7 0.1 — 3.8
Corporate securities 1,381.4 35.2 (10.3) 1,406.3
Mortgage-backed securities 1,744.3 33.5 (3.4) 1,774.4
Total fixed maturity securities 3,814.1 87.0 (18.4) 3,882.7
Equity securities—indexed mutual funds 185.7 3.4 — 189.1
$ 3,999.8 $ 90.4 $ (18.4) $ 4,071.8
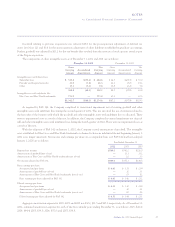
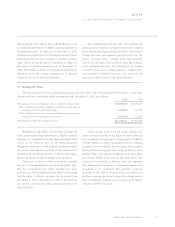
The amortized cost and fair value of fixed maturity
securities at December 31, 2002, by contractual maturity,
are shown below. Expected maturities may be less than
contractual maturities because the issuers of the securities
may have the right to prepay obligations without prepay-
ment penalties.
Amortized Fair
Cost Value
Due in one year or less $ 128.0 $ 129.2
Due after one year through five years 1,168.3 1,209.9
Due after five years through ten years 1,249.5 1,321.7
Due after ten years 630.7 677.7
3,176.5 3,338.5
Mortgage-backed securities 2,375.0 2,458.9
$5,551.5 $5,797.4
The major categories of net investment income are
as follows:
2002 2001 2000
Fixed maturity securities $255.2 $220.5 $178.8
Equity securities 3.6 6.4 6.1
Cash, cash
equivalents and other 7.0 15.7 21.5
Investment revenue 265.8 242.6 206.4
Investment expense (5.1) (4.0) (4.8)
Net investment income $260.7 $238.6 $201.6
Proceeds from sales of fixed maturity and equity
securities during 2002, 2001 and 2000 were $4,535.9,
$3,488.8 and $2,911.8, respectively. Gross gains of $72.7,
$164.3 and $71.3 and gross losses of $42.3, $103.5 and
$45.4 were realized in 2002, 2001 and 2000, respectively,
on those sales.