Anthem Blue Cross 2002 Annual Report Download - page 48
Download and view the complete annual report
Please find page 48 of the 2002 Anthem Blue Cross annual report below. You can navigate through the pages in the report by either clicking on the pages listed below, or by using the keyword search tool below to find specific information within the annual report.-
 1
1 -
2
-
3
-
4
-
5
-
6
-
7
-
8
-
9
-
10
-
11
-
12
-
13
-
14
-
15
-
16
-
17
-
18
-
19
-
20
-
21
-
22
-
23
-
24
-
25
-
26
-
27
-
28
-
29
-
30
-
31
-
32
-
33
-
34
-
35
-
36
-
37
-
 38
38 -
 39
39 -
 40
40 -
 41
41 -
 42
42 -
 43
43 -
 44
44 -
 45
45 -
 46
46 -
 47
47 -
 48
48 -
 49
49 -
 50
50 -
 51
51 -
 52
52 -
 53
53 -
 54
54 -
 55
55 -
 56
56 -
 57
57 -
 58
58 -
59
-
60
-
61
-
62
-
63
-
64
-
65
-
66
-
67
-
68
-
69
-
70
-
71
-
72
-
73
-
74
-
75
-
76
-
77
-
78
-
79
-
80
-
81
-
82
-
83
-
84
-
85
-
86
-
87
-
88
-
89
-
90
-
91
-
92
-
93
-
94
 |
 |

MANAGEMENT’S DISCUSSION AND ANALYSIS
of Financial Condition and Results of Operations (Continued)
Anthem, Inc. 2002 Annual Report 43
For the 12-month period ended December 31, 2001,
outpatient services cost trends generally averaged from
14% to 15%. These increases resulted from both increased
utilization and higher unit costs. Increased outpatient uti-
lization reflects an industry-wide trend toward a broader
range of medical procedures being performed without
overnight hospital stays, as well as an increasing customer
awareness of and demand for diagnostic procedures such as
magnetic resonance imagings, or MRIs. In addition,
improved medical technology has allowed more compli-
cated medical procedures to be performed on an outpa-
tient basis rather than on an inpatient (hospitalized) basis,
increasing both outpatient utilization rates and unit costs.
For the 12-month period ended December 31, 2001,
professional services cost trends generally averaged from
11% to 12%. These increases resulted from both increased
utilization and higher unit costs.
For the 12-month period ended December 31, 2001,
inpatient services trends were approximately 11%. This
increase was due to re-negotiation of provider contracts
and higher overall utilization, particularly for cardiac serv-
ices admissions. Hospitals have taken a more aggressive
stance in their contracting with health insurance compa-
nies as a result of reduced hospital reimbursements from
Medicare and pressure to recover the costs of additional
investments in new medical technology and facilities.
Administrative expense increased $177.7 million, or
10%, in 2001, which includes the impacts of our acquisi-
tion of BCBS-ME and our TRICARE operating results.
Excluding our acquisition of BCBS-ME and our TRICARE
operating results, administrative expense increased $194.0
million, or 12%, primarily due to higher commissions and
premium taxes, which vary with premium, higher salary
and benefit costs, additional costs associated with higher
membership and investments in technology. Our admin-
istrative expense ratio, calculated using operating revenue
and premium equivalents, decreased 120 basis points pri-
marily due to operating revenue increasing faster than
administrative expense.
Net investment income increased $37.0 million, or
18%, primarily due to our higher investment portfolio
balances. The higher portfolio balances included net cash
generated from operations, as well as cash generated from
improved balance sheet management, such as quicker
collection of receivables and liquidation of non-strategic
assets. Excluding the investment income earned by
BCBS-ME and TRICARE, net investment income
increased $31.7 million, or 16%. As returns on fixed
maturity portfolios are dependent on market interest rates
and changes in interest rates are unpredictable, there is
no certainty that past investment performance will be
repeated in the future.
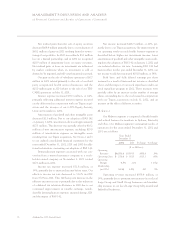
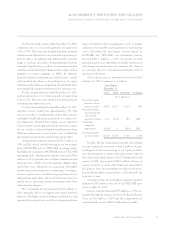
Net realized gains on investments increased $34.9
million, or 135%. A summary is as follows:
Years Ended
December 31
2001 2000 $ Change % Change
($ in Millions)
Net realized gains
from the sale of
equity securities $ 69.0 $ 43.5 $ 25.5 59%
Net realized gains
(losses) from the
sale of fixed
maturity securities 20.7 (17.6) 38.3 NM3
Other than
temporary
impairments (28.9) — (28.9) NM3
Net realized gains
on investments $ 60.8 $ 25.9 $ 34.9 135%
In 2001, the net realized gains from the sale of equity
securities primarily consisted of $65.2 million of gains
resulting from the restructuring of our equity portfolio
into fixed maturity securities and equity index funds in
the early to mid third quarter of 2001. During the second
quarter of 2001, we recognized $28.9 million of losses on
equity securities as other than temporary impairment.
Net gains or losses on investments are influenced by mar-
ket conditions when an investment is sold, and will vary
from year to year.
Our gain on the sale of subsidiary operations of $25.0
million in 2001 relates to the sale of our TRICARE oper-
ations on May 31, 2001.
Interest expense increased $5.5 million, or 10%, pri-
marily reflecting the issuance of our 6.00% Equity Security
Units on November 2, 2001 and the commitment fee
associated with our new $800.0 million line of credit.