Anthem Blue Cross 2002 Annual Report Download - page 37
Download and view the complete annual report
Please find page 37 of the 2002 Anthem Blue Cross annual report below. You can navigate through the pages in the report by either clicking on the pages listed below, or by using the keyword search tool below to find specific information within the annual report.-
 1
1 -
2
-
3
-
4
-
5
-
6
-
7
-
8
-
9
-
10
-
11
-
12
-
13
-
14
-
15
-
16
-
17
-
18
-
19
-
20
-
21
-
22
-
23
-
24
-
25
-
26
-
 27
27 -
 28
28 -
 29
29 -
 30
30 -
 31
31 -
 32
32 -
 33
33 -
 34
34 -
 35
35 -
 36
36 -
 37
37 -
 38
38 -
 39
39 -
 40
40 -
 41
41 -
 42
42 -
 43
43 -
 44
44 -
 45
45 -
 46
46 -
 47
47 -
48
-
49
-
50
-
51
-
52
-
53
-
54
-
55
-
56
-
57
-
58
-
59
-
60
-
61
-
62
-
63
-
64
-
65
-
66
-
67
-
68
-
69
-
70
-
71
-
72
-
73
-
74
-
75
-
76
-
77
-
78
-
79
-
80
-
81
-
82
-
83
-
84
-
85
-
86
-
87
-
88
-
89
-
90
-
91
-
92
-
93
-
94
 |
 |

MANAGEMENT’S DISCUSSION AND ANALYSIS
of Financial Condition and Results of Operations (Continued)
32 Anthem, Inc. 2002 Annual Report
Medicare + Choice membership increased 6,000, or 6%. Our 2001 membership count included 6,000 Colorado
Medicare + Choice members. As of January 1, 2002, we discontinued offering this product in Colorado. Excluding our
withdrawal from this market, membership increased 12,000, or 13%. This increase was primarily due to new business
in certain counties in Ohio, where many competitors have left the market, leaving us as one of the few remaining
companies offering this product.
Self-funded membership increased 399,000, or 10%, primarily due to an increase in National Accounts BlueCard
activity. Fully-insured membership grew by 222,000 members, or 6%, primarily in our Individual and Local Large Group
businesses, as explained above.
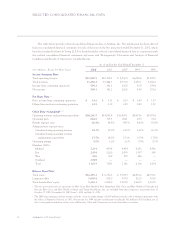
Results of Operations
Year Ended December 31, 2002 Compared to Year Ended December 31, 2001
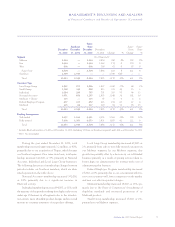
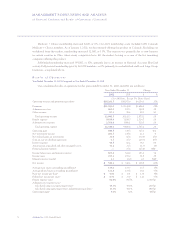
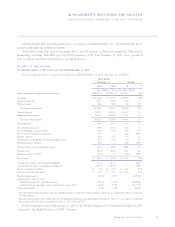
Our consolidated results of operations for the years ended December 31, 2002 and 2001 are as follows:
Years Ended December 31 Change
2002 2001 $ %
($ in Millions, Except Per Share Data)
Operating revenue and premium equivalents1$18,261.5 $14,057.4 $4,204.1 30%
Premiums $11,941.0 $ 9,244.8 $2,696.2 29%
Administrative fees 962.2 817.3 144.9 18
Other revenue 87.3 58.2 29.1 50
Total operating revenue 12,990.5 10,120.3 2,870.2 28
Benefit expense 9,839.4 7,814.7 2,024.7 26
Administrative expense 2,506.6 1,986.1 520.5 26
Total operating expense 12,346.0 9,800.8 2,545.2 26
Operating gain2644.5 319.5 325.0 102
Net investment income 260.7 238.6 22.1 9
Net realized gains on investments 30.4 60.8 (30.4) (50)
Gain on sale of subsidiary operations 0.7 25.0 (24.3) (97)
Interest expense 98.5 60.2 38.3 64
Amortization of goodwill and other intangible assets 30.2 31.5 (1.3) (4)
Demutualization expenses —27.6 (27.6) NM3
Income before taxes and minority interest 807.6 524.6 283.0 54
Income taxes 255.2 183.4 71.8 39
Minority interest (credit) 3.3 (1.0) 4.3 NM3
Net income $ 549.1 $ 342.2 $ 206.9 60%
Average basic shares outstanding (in millions)4119.0 103.3 15.7 15%
Average diluted shares outstanding (in millions)4121.8 103.8 18.0 17%
Basic net income per share4$ 4.61 $ 3.31 $ 1.30 39%
Diluted net income per share4$ 4.51 $ 3.30 $ 1.21 37%
Benefit expense ratio582.4% 84.5% (210) bp6
Administrative expense ratio:7
Calculated using total operating revenue819.3% 19.6% (30) bp6
Calculated using operating revenue and premium equivalents913.7% 14.1% (40) bp6
Operating margin10 5.0% 3.2% 180 bp6