Anthem Blue Cross 2002 Annual Report Download - page 74
Download and view the complete annual report
Please find page 74 of the 2002 Anthem Blue Cross annual report below. You can navigate through the pages in the report by either clicking on the pages listed below, or by using the keyword search tool below to find specific information within the annual report.-
 1
1 -
2
-
3
-
4
-
5
-
6
-
7
-
8
-
9
-
10
-
11
-
12
-
13
-
14
-
15
-
16
-
17
-
18
-
19
-
20
-
21
-
22
-
23
-
24
-
25
-
26
-
27
-
28
-
29
-
30
-
31
-
32
-
33
-
34
-
35
-
36
-
37
-
38
-
39
-
40
-
41
-
42
-
43
-
44
-
45
-
46
-
47
-
48
-
49
-
50
-
51
-
52
-
53
-
54
-
55
-
56
-
57
-
58
-
59
-
60
-
61
-
62
-
63
-
 64
64 -
 65
65 -
 66
66 -
 67
67 -
 68
68 -
 69
69 -
 70
70 -
 71
71 -
 72
72 -
 73
73 -
 74
74 -
 75
75 -
 76
76 -
 77
77 -
 78
78 -
 79
79 -
 80
80 -
 81
81 -
 82
82 -
 83
83 -
 84
84 -
85
-
86
-
87
-
88
-
89
-
90
-
91
-
92
-
93
-
94
 |
 |

NOTES
to Consolidated Financial Statements (Continued)
Anthem, Inc. 2002 Annual Report 69
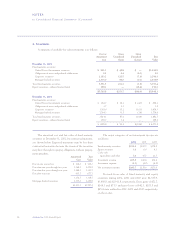
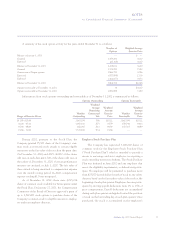
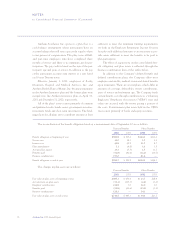
8. Unpaid Life, Accident and Health Claims
A reconciliation of the beginning and ending balances
for unpaid life, accident and health claims is as follows:
2002 2001 2000
Balances at January 1,
net of reinsurance $1,352.7 $1,382.1 $1,052.6
Business purchases
(divestitures) 379.4 (139.1) 113.9
Incurred related to:
Current year 9,965.1 7,843.1 6,593.6
Prior years (150.7) (96.4) (60.1)
Total incurred 9,814.4 7,746.7 6,533.5
Paid related to:
Current year 8,396.4 6,521.5 5,361.9
Prior years 1,328.9 1,115.5 956.0
Total paid 9,725.3 7,637.0 6,317.9
Balances at December 31,
net of reinsurance 1,821.2 1,352.7 1,382.1
Reinsurance recoverables
at December 31 4.8 7.6 29.0
Reserve gross of reinsurance
recoverables on unpaid
claims at December 31 $1,826.0 $1,360.3 $1,411.1
The amounts incurred related to prior years reflects
that the unpaid liability at the beginning of each of the
years for 2002, 2001 and 2000 was greater than the actual
subsequent development. This experience is primarily
attributable to actual medical cost experience more favor-
able than that assumed at the time the liability was estab-
lished as well as increased claims processing efficiencies due
to system migrations and other technological advances.
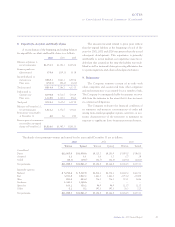
9. Reinsurance
The Company reinsures certain of its risks with
other companies and assumes risk from other companies
and such reinsurance is accounted for as a transfer of risk.
The Company is contingently liable for amounts recover-
able from the reinsurer in the event that it does not meet
its contractual obligations.
The Company evaluates the financial condition of
its reinsurers and monitors concentrations of credit risk
arising from similar geographic regions, activities, or eco-
nomic characteristics of the reinsurers to minimize its
exposure to significant losses from reinsurer insolvencies.
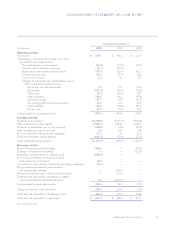
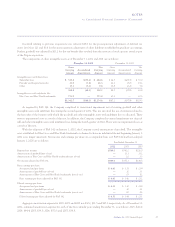
The details of net premiums written and earned for the years ended December 31 are as follows:
2002 2001 2000
Written Earned Written Earned Written Earned
Consolidated:
Direct $12,005.9 $11,959.6 $9,325.7 $9,285.9 $7,993.0 $7,961.5
Assumed 1.1 1.1 1.6 1.7 0.7 1.9
Ceded (18.3) (19.7) (42.5) (42.8) (229.2) (226.1)
Net premiums $11,988.7 $11,941.0 $9,284.8 $9,244.8 $7,764.5 $7,737.3
Reportable segments:
Midwest $ 5,756.4 $ 5,707.8 $4,814.2 $4,774.2 $4,240.4 $4,203.1
East 3,933.8 3,927.2 3,462.5 3,462.5 2,753.0 2,768.9
West 853.8 853.0 716.1 716.1 571.1 569.6
Southeast 1,341.3 1,349.6 —— ——
Specialty 103.2 103.2 94.9 94.9 123.7 123.7
Other 0.2 0.2 197.1 197.1 76.3 72.0
Net premiums $11,988.7 $11,941.0 $9,284.8 $9,244.8 $7,764.5 $7,737.3