Anthem Blue Cross 2002 Annual Report Download - page 56
Download and view the complete annual report
Please find page 56 of the 2002 Anthem Blue Cross annual report below. You can navigate through the pages in the report by either clicking on the pages listed below, or by using the keyword search tool below to find specific information within the annual report.-
 1
1 -
2
-
3
-
4
-
5
-
6
-
7
-
8
-
9
-
10
-
11
-
12
-
13
-
14
-
15
-
16
-
17
-
18
-
19
-
20
-
21
-
22
-
23
-
24
-
25
-
26
-
27
-
28
-
29
-
30
-
31
-
32
-
33
-
34
-
35
-
36
-
37
-
38
-
39
-
40
-
41
-
42
-
43
-
44
-
45
-
 46
46 -
 47
47 -
 48
48 -
 49
49 -
 50
50 -
 51
51 -
 52
52 -
 53
53 -
 54
54 -
 55
55 -
 56
56 -
 57
57 -
 58
58 -
 59
59 -
 60
60 -
 61
61 -
 62
62 -
 63
63 -
 64
64 -
 65
65 -
 66
66 -
67
-
68
-
69
-
70
-
71
-
72
-
73
-
74
-
75
-
76
-
77
-
78
-
79
-
80
-
81
-
82
-
83
-
84
-
85
-
86
-
87
-
88
-
89
-
90
-
91
-
92
-
93
-
94
 |
 |

MANAGEMENT’S DISCUSSION AND ANALYSIS
of Financial Condition and Results of Operations (Continued)
Anthem, Inc. 2002 Annual Report 51
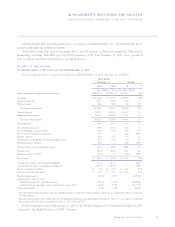
securities. Cash disbursements result mainly from benefit
expenses, administrative expenses, taxes, purchase of
investment securities and interest expense. Cash outflows
fluctuate with the amount and timing of settlement of these
expenses. As such, any future decline in our profitability
would likely have some negative impact on our liquidity.
We manage our cash, investments and capital struc-
ture so we are able to meet the short- and long-term obli-
gations of our business while maintaining financial
flexibility and liquidity. We forecast, analyze and monitor
our cash flows to enable investment and financing within
the overall constraints of our financial strategy.
A substantial portion of the assets held by our regu-
lated subsidiaries are in the form of cash, cash equivalents
and investments. After considering expected cash flows
from operating activities, we generally invest cash that
exceeds our near term obligations in longer term mar-
ketable fixed maturity securities, to improve our overall
investment income returns. Our investment strategy is to
make investments consistent with insurance statutes and
other regulatory requirements, while preserving our asset
base. Our investments are available for sale to meet liq-
uidity and other needs. Excess capital is paid in the form
of dividends by subsidiaries to their respective parent
companies for general corporate use, annually as permit-
ted by applicable regulations.
The availability of financing in the form of debt or
equity is influenced by many factors including our prof-
itability, operating cash flows, debt levels, debt ratings,
contractual restrictions, regulatory requirements and mar-
ket conditions. We have access to $1.0 billion of revolv-
ing credit facilities, which allow us to maintain further
operating and financial flexibility.
Liquidity—Year Ended December 31, 2002
Compared to Year Ended December 31, 2001
During 2002, net cash flow provided by operating
activities was $991.1 million, an increase of $336.5 million,
or 51%, over 2001. The increase is a reflection of our
improved net income. Higher non-cash expenses such as
depreciation and amortization, as well as favorable
changes in our operating assets and liabilities comple-
mented this increased net income to generate improved
cash flow from operations.
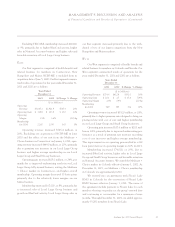
Net cash flow used in investing activities was
$1,411.9 million in 2002, compared to $498.1 million in
2001, an increase of $913.8 million. The table below out-
lines where the changes between the two years occurred:
Increase in purchases of subsidiaries $(785.5)
Decrease in proceeds from sales of subsidiaries (44.1)
Increase in net purchases of investments (40.9)
Increase in net purchases and proceeds
from sale of property and equipment (43.3)
Total increase in cash used
in investing activities $(913.8)
The increase in subsidiary purchases resulted prima-
rily from the Trigon acquisition in 2002, for which we
paid $772.4 million in net cash. Cash acquired on
Trigon’s balance sheet was $362.2 million, which partially
offset $1,134.6 million used for the purchase price and
transaction costs. The net decline in cash received from
divestitures between the two years reflects proceeds from
the sale of TRICARE in 2001, which did not occur in
2002. The purchase of investment securities increased as
operating cash was moved into our investment portfolio.
The increased property and equipment purchases include
$24.6 million of expenditures made by Trigon following
the acquisition date. The remainder of the increased
property purchases resulted from investments in computer
technology and software.
Net cash flow provided by financing activities was
$709.3 million in 2002 compared to $46.6 million in 2001.
On July 31, 2002, Anthem issued $950.0 million of long-
term senior unsecured notes ($150.0 million of 4.875%
notes due 2005, and $800.0 million of 6.800% notes due
2012). The net proceeds of $938.5 million from the note
offering were used to pay a portion of the approximately
$1,134.5 million of cash consideration and expenses associ-
ated with Anthem’s acquisition of Trigon. In addition,
$30.9 million of proceeds resulted from the issuance of
common stock related to the exercise of stock options and
through the employee stock purchase program. We used
$256.2 million to repurchase our common stock during
2002. The $46.6 million of cash provided by financing
activities during 2001 is related to the demutualization and
initial public offering, which is described below in
“Liquidity—Year Ended December 31, 2001 Compared to
Year Ended December 31, 2000.”