Anthem Blue Cross 2002 Annual Report Download - page 61
Download and view the complete annual report
Please find page 61 of the 2002 Anthem Blue Cross annual report below. You can navigate through the pages in the report by either clicking on the pages listed below, or by using the keyword search tool below to find specific information within the annual report.-
 1
1 -
2
-
3
-
4
-
5
-
6
-
7
-
8
-
9
-
10
-
11
-
12
-
13
-
14
-
15
-
16
-
17
-
18
-
19
-
20
-
21
-
22
-
23
-
24
-
25
-
26
-
27
-
28
-
29
-
30
-
31
-
32
-
33
-
34
-
35
-
36
-
37
-
38
-
39
-
40
-
41
-
42
-
43
-
44
-
45
-
46
-
47
-
48
-
49
-
50
-
 51
51 -
 52
52 -
 53
53 -
 54
54 -
 55
55 -
 56
56 -
 57
57 -
 58
58 -
 59
59 -
 60
60 -
 61
61 -
 62
62 -
 63
63 -
 64
64 -
 65
65 -
 66
66 -
 67
67 -
 68
68 -
 69
69 -
 70
70 -
 71
71 -
72
-
73
-
74
-
75
-
76
-
77
-
78
-
79
-
80
-
81
-
82
-
83
-
84
-
85
-
86
-
87
-
88
-
89
-
90
-
91
-
92
-
93
-
94
 |
 |

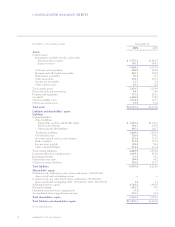
CONSOLIDATED BALANCE SHEETS
56 Anthem, Inc. 2002 Annual Report
(In Millions, Except Share Data) December 31
2002 2001
Assets
Current assets:
Investments available-for-sale, at fair value:
Fixed maturity securities $ 5,797.4 $3,882.7
Equity securities 150.7 189.1
5,948.1 4,071.8
Cash and cash equivalents 694.9 406.4
Premium and self-funded receivables 892.7 544.7
Reinsurance receivables 76.5 76.7
Other receivables 192.3 169.1
Income tax receivables 11.7 0.4
Other current assets 60.3 30.8
Total current assets 7,876.5 5,299.9
Restricted cash and investments 49.1 39.6
Property and equipment 537.4 402.3
Goodwill 2,484.9 338.1
Other intangible assets 1,274.6 129.3
Other noncurrent assets 70.6 67.4
Total assets $12,293.1 $6,276.6
Liabilities and shareholders’ equity
Liabilities
Current liabilities:
Policy liabilities:
Unpaid life, accident and health claims $ 1,826.0 $1,360.3
Future policy benefits 344.7 247.9
Other policyholder liabilities 497.3 243.7
Total policy liabilities 2,668.0 1,851.9
Unearned income 326.6 199.2
Accounts payable and accrued expenses 471.8 331.0
Bank overdrafts 357.9 310.7
Income taxes payable 109.8 52.4
Other current liabilities 514.8 231.4
Total current liabilities 4,448.9 2,976.6
Long term debt, less current portion 1,659.4 818.0
Retirement benefits 50.6 96.1
Deferred income taxes 389.9 55.2
Other noncurrent liabilities 382.0 270.7
Total liabilities 6,930.8 4,216.6
Shareholders’ equity
Preferred stock, without par value, shares authorized—100,000,000;
shares issued and outstanding—none ——
Common stock, par value $0.01, shares authorized—900,000,000;
shares issued and outstanding: 2002, 139,332,132; 2001, 103,295,675 1.4 1.1
Additional paid in capital 4,762.2 1,960.8
Retained earnings 481.3 55.7
Unearned restricted stock compensation (5.3) —
Accumulated other comprehensive income 122.7 42.4
Total shareholders’ equity 5,362.3 2,060.0
Total liabilities and shareholders’ equity $12,293.1 $6,276.6
See accompanying notes.