Anthem Blue Cross 2002 Annual Report Download - page 38
Download and view the complete annual report
Please find page 38 of the 2002 Anthem Blue Cross annual report below. You can navigate through the pages in the report by either clicking on the pages listed below, or by using the keyword search tool below to find specific information within the annual report.-
 1
1 -
2
-
3
-
4
-
5
-
6
-
7
-
8
-
9
-
10
-
11
-
12
-
13
-
14
-
15
-
16
-
17
-
18
-
19
-
20
-
21
-
22
-
23
-
24
-
25
-
26
-
27
-
 28
28 -
 29
29 -
 30
30 -
 31
31 -
 32
32 -
 33
33 -
 34
34 -
 35
35 -
 36
36 -
 37
37 -
 38
38 -
 39
39 -
 40
40 -
 41
41 -
 42
42 -
 43
43 -
 44
44 -
 45
45 -
 46
46 -
 47
47 -
 48
48 -
49
-
50
-
51
-
52
-
53
-
54
-
55
-
56
-
57
-
58
-
59
-
60
-
61
-
62
-
63
-
64
-
65
-
66
-
67
-
68
-
69
-
70
-
71
-
72
-
73
-
74
-
75
-
76
-
77
-
78
-
79
-
80
-
81
-
82
-
83
-
84
-
85
-
86
-
87
-
88
-
89
-
90
-
91
-
92
-
93
-
94
 |
 |

MANAGEMENT’S DISCUSSION AND ANALYSIS
of Financial Condition and Results of Operations (Continued)
Anthem, Inc. 2002 Annual Report 33
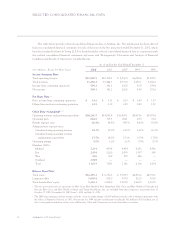
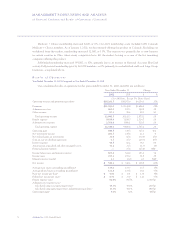
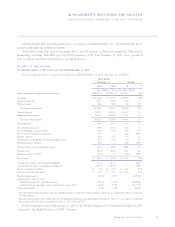
The following definitions are also applicable to all other results of operations tables and schedules in this discussion:
1Operating revenue and premium equivalents is a measure of the volume of business which is commonly used in the health benefits industry to
allow for a comparison of operating efficiency among companies. It is obtained by adding to premiums, administrative fees and other revenue,
the amount of claims attributable to non-Medicare, self-funded health business where we provide a complete array of customer service, claims
administration and billing and enrollment services, but the customer retains the risk of funding payments for health benefits provided to
members. The self-funded claims included for the year ended December 31, 2002 were $5,271.0 million (including $730.7 million from our
Southeast segment). For the year ended December 31, 2001, self-funded benefits were $3,937.1 million.
2Operating gain is a measure of operating performance of our business segments and represents total operating revenue less benefit expense and
administrative expense. It does not include net investment income, net realized gains on investments, gain on sale of subsidiary operations,
interest expense, amortization of goodwill and other intangible assets, demutualization expenses, income taxes and minority interest. Our
definition of operating gain may not be comparable to similarly titled measures reported by other companies. Further, operating gain should
not be construed as a replacement for or equivalent to income before income taxes and minority interest, which is a measure of pretax
profitability determined in accordance with accounting principles generally accepted in the United States.
3NM = Not meaningful.
4December 31, 2001 amounts represent pro forma earnings per share including the period prior to our initial public offering. See Note 11 to our
audited consolidated financial statements for the years ended December 31, 2002, 2001 and 2000.
5Benefit expense ratio = Benefit expense ÷ Premiums.
6bp = basis point; one hundred basis points = 1%.
7While we include two calculations of administrative expense ratio, we believe that administrative expense ratio including premium
equivalents is a better measure of efficiency as it eliminates changes in the ratio caused by changes in our mix of fully-insured and self-funded
business. All discussions and explanations related to administrative expense ratio will be related to administrative expense ratio including
premium equivalents.
8Administrative expense ratio calculated using total operating revenue = Administrative expense ÷ Total operating revenue.
9Administrative expense ratio calculated using operating revenue and premium equivalents = Administrative expense ÷ Operating revenue and
premium equivalents.
10 Operating margin = Operating gain ÷ Total operating revenue.
On May 31, 2001, we sold our TRICARE operations.
The results of our TRICARE operations were reported in
our Other segment during 2001 and included $263.2 mil-
lion in operating revenue and $4.2 million in operating
gain for the five months ended May 31, 2001.
Throughout the following discussion of our results of
operations, “same-store” excludes our TRICARE opera-
tions from 2001 and the operating results of our Trigon
acquisition from the date of purchase in 2002.
Premiums increased $2,696.2 million, or 29%, to
$11,941.0 million in 2002. On a same-store basis, premi-
ums increased $1,543.1 million, or 17%, due to premium
rate increases and growth in our fully-insured member-
ship. Our premium yields, net of benefit buy-downs for
our fully-insured Local Large Group and Small Group
businesses, increased approximately 14% on a rolling 12-
month basis as of December 31, 2002, both on a same-
store basis and after including Southeast premiums. Also
contributing to premium growth was higher fully-insured
membership in all of our business segments.
Administrative fees increased $144.9 million, or
18%, including administrative fees following Trigon’s
acquisition date in 2002. On a same-store basis, adminis-
trative fees increased $98.2 million, or 13%, primarily due
to increased BlueCard activity and increased administra-
tive fees from AdminaStar Federal’s 1-800 Medicare Help
Line contract with the Centers for Medicare and
Medicaid Services, or CMS. During the fourth quarter of
2002, CMS awarded this contract to a different company,
despite our superior performance ratings earned each year
since receiving the contract in 1997. We will begin tran-
sitioning this contract to the new contractor beginning
April 1, 2003.