Anthem Blue Cross 2002 Annual Report Download - page 51
Download and view the complete annual report
Please find page 51 of the 2002 Anthem Blue Cross annual report below. You can navigate through the pages in the report by either clicking on the pages listed below, or by using the keyword search tool below to find specific information within the annual report.-
 1
1 -
2
-
3
-
4
-
5
-
6
-
7
-
8
-
9
-
10
-
11
-
12
-
13
-
14
-
15
-
16
-
17
-
18
-
19
-
20
-
21
-
22
-
23
-
24
-
25
-
26
-
27
-
28
-
29
-
30
-
31
-
32
-
33
-
34
-
35
-
36
-
37
-
38
-
39
-
40
-
 41
41 -
 42
42 -
 43
43 -
 44
44 -
 45
45 -
 46
46 -
 47
47 -
 48
48 -
 49
49 -
 50
50 -
 51
51 -
 52
52 -
 53
53 -
 54
54 -
 55
55 -
 56
56 -
 57
57 -
 58
58 -
 59
59 -
 60
60 -
 61
61 -
62
-
63
-
64
-
65
-
66
-
67
-
68
-
69
-
70
-
71
-
72
-
73
-
74
-
75
-
76
-
77
-
78
-
79
-
80
-
81
-
82
-
83
-
84
-
85
-
86
-
87
-
88
-
89
-
90
-
91
-
92
-
93
-
94
 |
 |

MANAGEMENT’S DISCUSSION AND ANALYSIS
of Financial Condition and Results of Operations (Continued)
46 Anthem, Inc. 2002 Annual Report
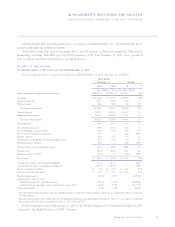
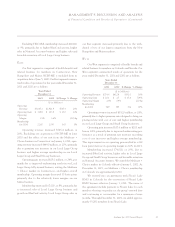
Specialty
Our Specialty segment includes our group life and
disability insurance benefits, pharmacy benefit manage-
ment, dental and vision administration services and third
party occupational health services. Our Specialty seg-
ment’s summarized results of operations for the years
ended December 31, 2001 and 2000 are as follows:
Years Ended
December 31
2001 2000 $ Change % Change
($ in Millions)
Operating Revenue $396.1 $332.3 $63.8 19%
Operating Gain $ 32.9 $ 24.9 $ 8.0 32%
Operating Margin 8.3% 7.5% 80 bp
Operating revenue increased $63.8 million, or 19%,
primarily due to higher revenue at APM. APM’s operat-
ing revenue grew primarily due to increased mail-order
prescription volume and the implementation of APM’s
pharmacy benefit programs beginning in 2001 by BCBS-
CO/NV and BCBS-ME, and in late 2000 by BCBS-NH.
Mail-service membership increased 28%, while retail-
service membership decreased 13%. Mail-service pre-
scription volume increased 38% and retail prescription
volume increased 31%. This growth more than offset the
effect of the termination of a special funding arrangement
with a large life group on December 31, 2000, which
decreased premiums by $28.8 million, or 23%. This group
accounted for $35.9 million of life and disability premi-
ums for 2000 and contributed very low margins to our
Specialty segment’s profitability.
Operating gain increased $8.0 million, or 32%, pri-
marily due to increased mail-order prescription volume at
APM. Improved APM results, coupled with the termina-
tion of the large life group, resulted in an 80 basis point
increase in our operating margin to 8.3%.
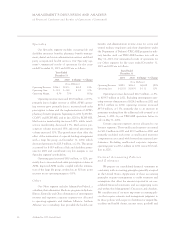
Other
Our Other segment includes AdminaStar Federal, a
subsidiary that administers Medicare programs in Indiana,
Illinois, Kentucky and Ohio; elimination of intersegment
revenue and expenses; corporate expenses not allocated
to operating segments; and Anthem Alliance. Anthem
Alliance was a subsidiary that provided the health care
benefits and administration in nine states for active and
retired military employees and their dependents under
the Department of Defense’s TRICARE program for mili-
tary families until our TRICARE business was sold on
May 31, 2001. Our summarized results of operations for
our Other segment for the years ended December 31,
2001 and 2000 are as follows:
Years Ended
December 31
2001 2000 $ Change % Change
($ in Millions)
Operating Revenue $189.5 $206.4 $(16.9) (8)%
Operating Loss $ (23.8) $(34.9) $ 11.1 32%
Operating revenue decreased $16.9 million, or 8%,
to $189.5 million in 2001. Excluding intersegment oper-
ating revenue eliminations of $214.0 million in 2001 and
$151.7 million in 2000, operating revenue increased
$45.4 million, or 13%, primarily due to an increase in
premiums resulting from the additional risk assumed as of
January 1, 2001, by our TRICARE operations before its
sale on May 31, 2001.
Certain corporate expenses are not allocated to our
business segments. These unallocated expenses accounted
for $33.0 million in 2001 and $39.9 million in 2000, and
primarily included such items as unallocated incentive
compensation associated with better than expected per-
formance. Excluding unallocated corporate expenses,
operating gain was $9.2 million in 2001 versus $5.0 mil-
lion in 2000.
Critical Accounting Policies
and Estimates
We prepare our consolidated financial statements in
conformity with accounting principles generally accepted
in the United States. Application of these accounting
principles requires management to make estimates and
assumptions that affect the amounts reported in our con-
solidated financial statements and accompanying notes
and within this Management’s Discussion and Analysis.
We consider some of our most important accounting poli-
cies that require estimates and management judgment to
be those policies with respect to liabilities for unpaid life,
accident and health claims, income taxes, goodwill and