Anthem Blue Cross 2002 Annual Report Download - page 64
Download and view the complete annual report
Please find page 64 of the 2002 Anthem Blue Cross annual report below. You can navigate through the pages in the report by either clicking on the pages listed below, or by using the keyword search tool below to find specific information within the annual report.-
 1
1 -
2
-
3
-
4
-
5
-
6
-
7
-
8
-
9
-
10
-
11
-
12
-
13
-
14
-
15
-
16
-
17
-
18
-
19
-
20
-
21
-
22
-
23
-
24
-
25
-
26
-
27
-
28
-
29
-
30
-
31
-
32
-
33
-
34
-
35
-
36
-
37
-
38
-
39
-
40
-
41
-
42
-
43
-
44
-
45
-
46
-
47
-
48
-
49
-
50
-
51
-
52
-
53
-
 54
54 -
 55
55 -
 56
56 -
 57
57 -
 58
58 -
 59
59 -
 60
60 -
 61
61 -
 62
62 -
 63
63 -
 64
64 -
 65
65 -
 66
66 -
 67
67 -
 68
68 -
 69
69 -
 70
70 -
 71
71 -
 72
72 -
 73
73 -
 74
74 -
75
-
76
-
77
-
78
-
79
-
80
-
81
-
82
-
83
-
84
-
85
-
86
-
87
-
88
-
89
-
90
-
91
-
92
-
93
-
94
 |
 |

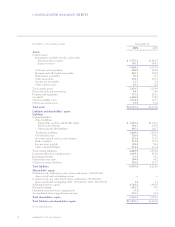
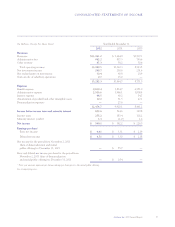
CONSOLIDATED STATEMENTS OF CASH FLOWS
Anthem, Inc. 2002 Annual Report 59
Year Ended December 31
(In Millions) 2002 2001 2000
Operating activities
Net income $ 549.1 $ 342.2 $ 226.0
Adjustments to reconcile net income to net cash
provided by operating activities:
Net realized gains on investments (30.4) (60.8) (25.9)
Gain on sale of subsidiary operations (0.7) (25.0) —
Depreciation, amortization and accretion 157.0 120.5 102.1
Deferred income taxes 63.3 71.4 36.6
Loss on sale of assets 2.2 3.1 0.5
Changes in operating assets and liabilities, net of
effect of purchases and divestitures:
Restricted cash and investments 4.7 8.1 10.0
Receivables (107.3) (28.0) (70.7)
Other assets (5.5) (16.7) 25.3
Policy liabilities 228.5 192.7 158.4
Unearned income 47.7 29.7 (12.0)
Accounts payable and accrued expenses 37.0 27.8 69.9
Other liabilities 20.2 (48.8) 116.8
Income taxes 25.3 38.4 47.5
Cash provided by operating activities 991.1 654.6 684.5
Investing activities
Purchases of investments (5,059.8) (3,957.3) (3,544.8)
Sales or maturities of investments 4,546.2 3,484.6 2,925.2
Purchases of subsidiaries, net of cash acquired (789.6) (4.1) (85.1)
Sales of subsidiaries, net of cash sold 0.9 45.0 5.4
Proceeds from sale of property and equipment 13.7 4.1 11.5
Purchases of property and equipment (123.3) (70.4) (73.3)
Cash used in investing activities (1,411.9) (498.1) (761.1)
Financing activities
Proceeds from long term borrowings 938.5 — 295.9
Payments on long term borrowings —— (220.4)
Repurchase and retirement of common stock (256.2) ——
Proceeds from employee stock purchase plan
and exercise of stock options 30.9 ——
Costs related to the issuance of shares for the Trigon acquisition (4.1) ——
Net proceeds from common stock issued in
the initial public offering —1,890.4 —
Net proceeds from issuance of Equity Security Units —219.8 —
Payments and adjustments to payments to eligible
statutory members in the demutualization 0.2 (2,063.6) —
Cash provided by financing activities 709.3 46.6 75.5
Change in cash and cash equivalents 288.5 203.1 (1.1)
Cash and cash equivalents at beginning of year 406.4 203.3 204.4
Cash and cash equivalents at end of year $ 694.9 $ 406.4 $ 203.3
See accompanying notes.