Anthem Blue Cross 2002 Annual Report Download - page 35
Download and view the complete annual report
Please find page 35 of the 2002 Anthem Blue Cross annual report below. You can navigate through the pages in the report by either clicking on the pages listed below, or by using the keyword search tool below to find specific information within the annual report.-
 1
1 -
2
-
3
-
4
-
5
-
6
-
7
-
8
-
9
-
10
-
11
-
12
-
13
-
14
-
15
-
16
-
17
-
18
-
19
-
20
-
21
-
22
-
23
-
24
-
 25
25 -
 26
26 -
 27
27 -
 28
28 -
 29
29 -
 30
30 -
 31
31 -
 32
32 -
 33
33 -
 34
34 -
 35
35 -
 36
36 -
 37
37 -
 38
38 -
 39
39 -
 40
40 -
 41
41 -
 42
42 -
 43
43 -
 44
44 -
 45
45 -
46
-
47
-
48
-
49
-
50
-
51
-
52
-
53
-
54
-
55
-
56
-
57
-
58
-
59
-
60
-
61
-
62
-
63
-
64
-
65
-
66
-
67
-
68
-
69
-
70
-
71
-
72
-
73
-
74
-
75
-
76
-
77
-
78
-
79
-
80
-
81
-
82
-
83
-
84
-
85
-
86
-
87
-
88
-
89
-
90
-
91
-
92
-
93
-
94
 |
 |

MANAGEMENT’S DISCUSSION AND ANALYSIS
of Financial Condition and Results of Operations (Continued)
30 Anthem, Inc. 2002 Annual Report
•National Accounts customers are employer groups
which have multi-state locations and require partner-
ing with other Blue Cross and Blue Shield plans for
administration and/or access to non-Anthem provider
networks. Included within the National Accounts
business are our BlueCard威customers who represent
enrollees of health plans marketed by other Blue Cross
and Blue Shield Plans, or the home plans, who receive
health care services in our Blue Cross and Blue Shield
licensed markets.
•Medicare + Choice members (age 65 and over) have
enrolled in coverages that are managed care alterna-
tives for the Medicare program.
•The Federal Employee Program, or FEP, provides
health insurance coverage to United States govern-
ment employees and their dependents within our geo-
graphic markets through our participation in the
national contract between the BCBSA and the U.S.
Office of Personnel Management, or OPM.
•Medicaid membership represents eligible members with
state sponsored managed care alternatives in the
Medicaid programs which we manage for the states of
Connecticut, New Hampshire and Virginia.
BlueCard membership, mentioned above as part of
our National Accounts membership, is calculated based
on the amount of BlueCard administrative fees we receive
from the BlueCard members’ home plans. The adminis-
trative fees we receive are based on the number and type
of claims we process, both institutional and professional,
and a portion of the network discount on those claims
from providers in our network who have provided service
to BlueCard members. To calculate membership, adminis-
trative fees are divided by an average per member per
month, or PMPM, factor. The average PMPM factor is
determined using a historical average administrative fee
per claim and an average number of claims per member
per year based on our experience and BCBSA guidelines.
In addition to reporting our membership by customer
type, we report membership by funding arrangement
according to the level of risk we assume in the product
contract. Our two funding arrangement categories are
fully-insured and self-funded. Self-funded products are
offered to customers, generally larger employers, who
elect to retain some or all of the financial risk associated
with their employees’ health care costs. Some employers
choose to purchase stop-loss coverage to limit their
retained risk.
The renewal patterns of our fully-insured Local
Large Group and Small Group business, including our
Southeast segment, are as follows: approximately 35% of
renewals occur during the first quarter, approximately
18% of renewals occur during the second quarter, approx-
imately 31% of renewals occur during the third quarter
and approximately 16% of renewals occur during the
fourth quarter. These renewal patterns have remained
consistent over the past year and allow us to adjust our
pricing and benefit plan designs in response to market
conditions throughout the year.
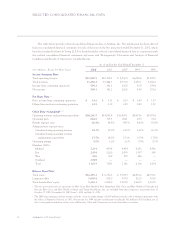
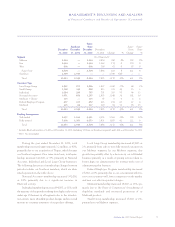
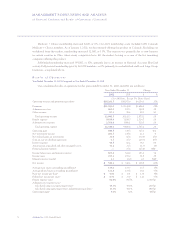
The following table presents our health membership
count by segment, customer type and funding arrange-
ment as of December 31, 2002 and 2001, comparing total
and same-store membership respectively. We define same-
store membership as our membership at a given period end
in a segment or for a particular customer or funding type,
after excluding the impact of members obtained through
acquisitions or lost through dispositions during such
period. We believe that same-store membership counts
best capture the rate of organic growth of our operations
period over period. The membership data presented is
unaudited and in certain instances includes estimates of
the number of members represented by each contract at
the end of the period, rounded to the nearest thousand.