ADT 2015 Annual Report Download - page 76
Download and view the complete annual report
Please find page 76 of the 2015 ADT annual report below. You can navigate through the pages in the report by either clicking on the pages listed below, or by using the keyword search tool below to find specific information within the annual report.-
 1
1 -
2
-
3
-
4
-
5
-
6
-
7
-
8
-
9
-
10
-
11
-
12
-
13
-
14
-
15
-
16
-
17
-
18
-
19
-
20
-
21
-
22
-
23
-
24
-
25
-
26
-
27
-
28
-
29
-
30
-
31
-
32
-
33
-
34
-
35
-
36
-
37
-
38
-
39
-
40
-
41
-
42
-
43
-
44
-
45
-
46
-
47
-
48
-
49
-
50
-
51
-
52
-
53
-
54
-
55
-
56
-
57
-
58
-
59
-
60
-
61
-
62
-
63
-
64
-
65
-
 66
66 -
 67
67 -
 68
68 -
 69
69 -
 70
70 -
 71
71 -
 72
72 -
 73
73 -
 74
74 -
 75
75 -
 76
76 -
 77
77 -
 78
78 -
 79
79 -
 80
80 -
 81
81 -
 82
82 -
 83
83 -
 84
84 -
 85
85 -
 86
86 -
87
-
88
-
89
-
90
-
91
-
92
-
93
-
94
-
95
-
96
-
97
-
98
-
99
-
100
-
101
-
102
-
103
-
104
-
105
-
106
-
107
-
108
-
109
-
110
-
111
-
112
-
113
-
114
-
115
-
116
-
117
-
118
-
119
-
120
-
121
-
122
-
123
-
124
-
125
-
126
-
127
-
128
-
129
-
130
-
131
-
132
-
133
-
134
-
135
-
136
-
137
-
138
-
139
-
140
-
141
-
142
-
143
-
144
-
145
-
146
-
147
-
148
-
149
-
150
-
151
-
152
-
153
-
154
-
155
-
156
-
157
-
158
-
159
-
160
-
161
-
162
-
163
-
164
-
165
-
166
-
167
-
168
-
169
-
170
-
171
-
172
-
173
-
174
-
175
-
176
-
177
-
178
-
179
-
180
-
181
-
182
-
183
 |
 |

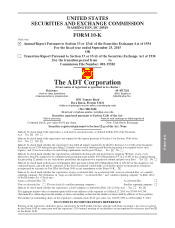
FORM 10-K
Revenue by segment for the fiscal year ended September 25, 2015 is as follows ($ in millions):
2015
Revenue
% of Total
Revenue
United States ..................................... $3,294 92.2%
Canada ......................................... 280 7.8
Total ....................................... $3,574 100.0%
For a detailed discussion of financial information by segment and geographic area for fiscal years 2015,
2014 and 2013, see Item 7. Management’s Discussion and Analysis and Note 12 to the Consolidated Financial
Statements. Unless otherwise indicated, references in this Annual Report on Form 10-K to 2015, 2014 and 2013
are to our fiscal years ended September 25, 2015, September 26, 2014 and September 27, 2013, respectively.
In order to optimize the financial performance of our business, we focus on several key business drivers,
including customer additions, costs to add a new customer, average revenue per customer, costs incurred to
provide services to customers and customer tenure. We believe we have a proven track record of successfully
balancing these key business drivers to optimize our financial returns. We use a structured customer acquisition
process designed to generate new customers with attractive characteristics including, high adoption of automatic
payment methods and strong credit scores, and interactive service contracts, which we believe results in long
average customer tenure. We have made customer retention a top priority, and partner with leading market
research companies to collect and analyze feedback from new and existing customers, enabling us to focus our
efforts on the aspects of the customer experience that most strongly correlate to customer satisfaction and tenure.
The majority of the monitoring and home/business automation services and a large portion of the
maintenance services we provide to our customers are governed by multi-year contracts with automatic renewal
provisions. This provides us with significant recurring revenue, which for 2015, was approximately 93% of our
consolidated revenue. We believe that the recurring nature of the majority of our revenue, combined with our
large customer base and increasing average revenue per customer, enables us to invest continuously in growing
and optimizing our business. This includes investments in technologies to further enhance the attractiveness of
our solutions to current and potential customers, to continue development and training to enable our direct sales,
installation, customer service and field service personnel to more effectively deliver exceptional service to our
customers, to expand our dealer and partner network and to make continued enhancements to operational
efficiency.
Our business plan contemplates the achievement of sustained, profitable growth in the markets we serve
today, as well as in adjacent markets, by executing against strategies that leverage our key assets and core
competencies. Where appropriate, we plan to supplement our organic growth efforts with complementary
acquisitions.
We will continue to manage our business by optimizing the key business drivers noted above to maximize
the value from and to our customers. We also believe there is significant opportunity to increase our share of
monitored security and premises automation for an expanded business market, including small and mid-sized
businesses. Therefore, we plan to continue to grow our share of business customers by expanding our business
field sales force, supplemented with dedicated commercial sales professionals, and strengthen our business
marketing support. We believe these actions will contribute to building a larger, more robust partner network and
to assist in marketing additional value-added services, including ADT Pulse®, our remote monitoring and home/
business automation system.
Additionally, we believe monitored security and home/business automation services remain underpenetrated
in North America. The number of U.S. households with monitored security systems continues to be significantly
lower than those with other home services such as video and Internet. We continue to increase penetration of
2