ADT 2015 Annual Report Download - page 119
Download and view the complete annual report
Please find page 119 of the 2015 ADT annual report below. You can navigate through the pages in the report by either clicking on the pages listed below, or by using the keyword search tool below to find specific information within the annual report.-
 1
1 -
2
-
3
-
4
-
5
-
6
-
7
-
8
-
9
-
10
-
11
-
12
-
13
-
14
-
15
-
16
-
17
-
18
-
19
-
20
-
21
-
22
-
23
-
24
-
25
-
26
-
27
-
28
-
29
-
30
-
31
-
32
-
33
-
34
-
35
-
36
-
37
-
38
-
39
-
40
-
41
-
42
-
43
-
44
-
45
-
46
-
47
-
48
-
49
-
50
-
51
-
52
-
53
-
54
-
55
-
56
-
57
-
58
-
59
-
60
-
61
-
62
-
63
-
64
-
65
-
66
-
67
-
68
-
69
-
70
-
71
-
72
-
73
-
74
-
75
-
76
-
77
-
78
-
79
-
80
-
81
-
82
-
83
-
84
-
85
-
86
-
87
-
88
-
89
-
90
-
91
-
92
-
93
-
94
-
95
-
96
-
97
-
98
-
99
-
100
-
101
-
102
-
103
-
104
-
105
-
106
-
107
-
108
-
 109
109 -
 110
110 -
 111
111 -
 112
112 -
 113
113 -
 114
114 -
 115
115 -
 116
116 -
 117
117 -
 118
118 -
 119
119 -
 120
120 -
 121
121 -
 122
122 -
 123
123 -
 124
124 -
 125
125 -
 126
126 -
 127
127 -
 128
128 -
 129
129 -
130
-
131
-
132
-
133
-
134
-
135
-
136
-
137
-
138
-
139
-
140
-
141
-
142
-
143
-
144
-
145
-
146
-
147
-
148
-
149
-
150
-
151
-
152
-
153
-
154
-
155
-
156
-
157
-
158
-
159
-
160
-
161
-
162
-
163
-
164
-
165
-
166
-
167
-
168
-
169
-
170
-
171
-
172
-
173
-
174
-
175
-
176
-
177
-
178
-
179
-
180
-
181
-
182
-
183
 |
 |

FORM 10-K
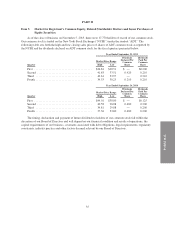
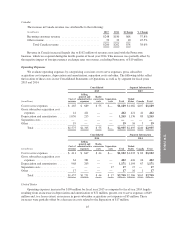
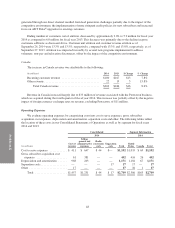
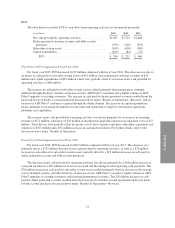
Canada
The increase in Canada revenue was attributable to the following:
(in millions) 2015 2014 $ Change % Change
Recurring customer revenue .......................... $248 $180 $68 37.8%
Other revenue ...................................... 32 22 10 45.5%
Total Canada revenue ........................... $280 $202 $78 38.6%
Revenue in Canada increased largely due to $102 million of revenue associated with the Protectron
business, which we acquired during the fourth quarter of fiscal year 2014. This increase was partially offset by
the negative impact of foreign currency exchange rates on revenue, excluding Protectron, of $19 million.
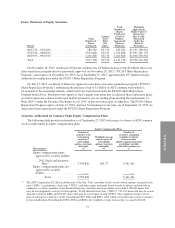
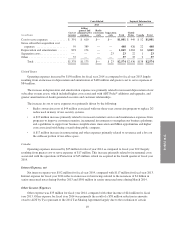
Operating Expenses
We evaluate operating expenses by categorizing costs into cost to serve expenses, gross subscriber
acquisition cost expenses, depreciation and amortization, separation costs and other. The following tables reflect
the location of these costs in our Consolidated Statements of Operations as well as by segment for fiscal years
2015 and 2014:
Consolidated Segment Information
2015 2015
(in millions)
Cost of
revenue
Selling,
general and
administrative
expenses
Radio
conversion
costs
Separation
costs Total
United
States Canada Total
Cost to serve expenses ............ $ 465 $ 669 $ 55 $— $1,189 $1,082 $107 $1,189
Gross subscriber acquisition cost
expenses ..................... 41 421 — — 462 421 41 462
Depreciation and amortization ...... 1,050 215 — — 1,265 1,176 89 1,265
Separation costs .................. — — — — ——— —
Other .......................... 19 — — — 19 16 3 19
Total ...................... $1,575 $1,305 $ 55 $— $2,935 $2,695 $240 $2,935
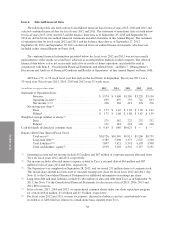
Consolidated Segment Information
2014 2014
(in millions)
Cost of
revenue
Selling,
general and
administrative
expenses
Radio
conversion
costs
Separation
costs Total
United
States Canada Total
Cost to serve expenses ............ $ 411 $ 647 $ 44 $— $1,102 $1,033 $ 69 $1,102
Gross subscriber acquisition cost
expenses ..................... 61 381 — — 442 416 26 442
Depreciation and amortization ...... 968 203 — — 1,171 1,104 67 1,171
Separation costs .................. — — — 17 17 17 — 17
Other .......................... 17 — — — 17 16 1 17
Total ...................... $1,457 $1,231 $ 44 $ 17 $2,749 $2,586 $163 $2,749
United States
Operating expenses increased by $109 million for fiscal year 2015 as compared to fiscal year 2014 largely
resulting from an increase in depreciation and amortization of $72 million, greater cost to serve expenses of $49
million and, to a lesser extent, an increase in gross subscriber acquisition cost expenses of $5 million. These
increases were partially offset by a decrease in costs related to the Separation of $17 million.
45