ADT 2015 Annual Report Download - page 127
Download and view the complete annual report
Please find page 127 of the 2015 ADT annual report below. You can navigate through the pages in the report by either clicking on the pages listed below, or by using the keyword search tool below to find specific information within the annual report.-
 1
1 -
2
-
3
-
4
-
5
-
6
-
7
-
8
-
9
-
10
-
11
-
12
-
13
-
14
-
15
-
16
-
17
-
18
-
19
-
20
-
21
-
22
-
23
-
24
-
25
-
26
-
27
-
28
-
29
-
30
-
31
-
32
-
33
-
34
-
35
-
36
-
37
-
38
-
39
-
40
-
41
-
42
-
43
-
44
-
45
-
46
-
47
-
48
-
49
-
50
-
51
-
52
-
53
-
54
-
55
-
56
-
57
-
58
-
59
-
60
-
61
-
62
-
63
-
64
-
65
-
66
-
67
-
68
-
69
-
70
-
71
-
72
-
73
-
74
-
75
-
76
-
77
-
78
-
79
-
80
-
81
-
82
-
83
-
84
-
85
-
86
-
87
-
88
-
89
-
90
-
91
-
92
-
93
-
94
-
95
-
96
-
97
-
98
-
99
-
100
-
101
-
102
-
103
-
104
-
105
-
106
-
107
-
108
-
109
-
110
-
111
-
112
-
113
-
114
-
115
-
116
-
 117
117 -
 118
118 -
 119
119 -
 120
120 -
 121
121 -
 122
122 -
 123
123 -
 124
124 -
 125
125 -
 126
126 -
 127
127 -
 128
128 -
 129
129 -
 130
130 -
 131
131 -
 132
132 -
 133
133 -
 134
134 -
 135
135 -
 136
136 -
 137
137 -
138
-
139
-
140
-
141
-
142
-
143
-
144
-
145
-
146
-
147
-
148
-
149
-
150
-
151
-
152
-
153
-
154
-
155
-
156
-
157
-
158
-
159
-
160
-
161
-
162
-
163
-
164
-
165
-
166
-
167
-
168
-
169
-
170
-
171
-
172
-
173
-
174
-
175
-
176
-
177
-
178
-
179
-
180
-
181
-
182
-
183
 |
 |

FORM 10-K
FCF
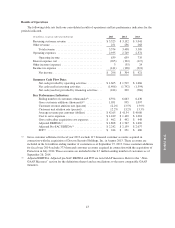
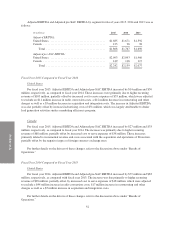
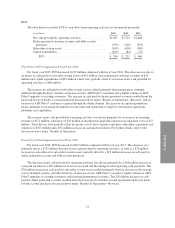
The table below reconciles FCF to cash flows from operating activities for the periods presented.
(in millions) 2015 2014 2013
Net cash provided by operating activities ................ $1,605 $1,519 $1,666
Dealer generated customer accounts and bulk account
purchases ....................................... (559) (526) (555)
Subscriber system assets ............................. (699) (658) (580)
Capital expenditures ................................. (103) (84) (71)
FCF.......................................... $ 244 $ 251 $ 460
Fiscal Year 2015 Compared to Fiscal Year 2014
For fiscal year 2015, FCF decreased by $7 million compared with fiscal year 2014. This decrease was due to
increases in cash paid for subscriber system assets of $41 million, dealer generated customer accounts of $33
million and capital expenditures of $19 million which were partially offset by increases in net cash provided by
operating activities of $86 million.
The increase in cash paid for subscriber system assets resulted primarily from greater gross customer
additions through the direct channel, an increase in new ADT Pulse®customers and a higher volume of ADT
Pulse®upgrades to existing customers. The increase in cash paid for dealer generated accounts resulted from the
increased levels of dealer account production discussed above under “Results of Operations—Revenue” and an
increase in ADT Pulse®customers acquired through the dealer channel. The increase in capital expenditures
relates primarily to increased investments in real estate and technology to improve our business operations,
platforms and capabilities.
The increase in net cash provided by operating activities was driven primarily by an increase in recurring
revenue of $171 million, a decrease of $43 million in income taxes paid and a decrease in separation costs of $17
million. These drivers were partially offset by greater cost to serve expenses and gross subscriber acquisition cost
expenses of $107 million and a $31 million increase in cash paid for interest. For further details, refer to the
discussion above under “Results of Operations.”
Fiscal Year 2014 Compared to Fiscal Year 2013
For fiscal year 2014, FCF decreased by $209 million compared with fiscal year 2013. This decrease was
primarily due to a $147 million decrease in net cash provided by operating activities, as well as a $78 million
increase in cash outlays for subscriber system assets, partially offset by a $29 million decrease in cash paid for
dealer generated accounts and bulk account purchases.
The decrease in net cash provided by operating activities was driven primarily by a $64 million increase in
cash paid for interest, a $63 million increase in taxes paid and the timing of other operating cash payments. The
$78 million increase in cash paid for subscriber system assets resulted primarily from an increase in the average
cost of installed systems, partially driven by an increase in new ADT Pulse®customers, higher volume of ADT
Pulse®upgrades to existing customers and increased promotional activities. The $29 million decrease in cash
paid for dealer generated accounts resulted from the lower levels of dealer account production and lower levels
of bulk account purchases discussed above under “Results of Operations—Revenue.”
53