ADT 2015 Annual Report Download - page 118
Download and view the complete annual report
Please find page 118 of the 2015 ADT annual report below. You can navigate through the pages in the report by either clicking on the pages listed below, or by using the keyword search tool below to find specific information within the annual report.-
 1
1 -
2
-
3
-
4
-
5
-
6
-
7
-
8
-
9
-
10
-
11
-
12
-
13
-
14
-
15
-
16
-
17
-
18
-
19
-
20
-
21
-
22
-
23
-
24
-
25
-
26
-
27
-
28
-
29
-
30
-
31
-
32
-
33
-
34
-
35
-
36
-
37
-
38
-
39
-
40
-
41
-
42
-
43
-
44
-
45
-
46
-
47
-
48
-
49
-
50
-
51
-
52
-
53
-
54
-
55
-
56
-
57
-
58
-
59
-
60
-
61
-
62
-
63
-
64
-
65
-
66
-
67
-
68
-
69
-
70
-
71
-
72
-
73
-
74
-
75
-
76
-
77
-
78
-
79
-
80
-
81
-
82
-
83
-
84
-
85
-
86
-
87
-
88
-
89
-
90
-
91
-
92
-
93
-
94
-
95
-
96
-
97
-
98
-
99
-
100
-
101
-
102
-
103
-
104
-
105
-
106
-
107
-
 108
108 -
 109
109 -
 110
110 -
 111
111 -
 112
112 -
 113
113 -
 114
114 -
 115
115 -
 116
116 -
 117
117 -
 118
118 -
 119
119 -
 120
120 -
 121
121 -
 122
122 -
 123
123 -
 124
124 -
 125
125 -
 126
126 -
 127
127 -
 128
128 -
129
-
130
-
131
-
132
-
133
-
134
-
135
-
136
-
137
-
138
-
139
-
140
-
141
-
142
-
143
-
144
-
145
-
146
-
147
-
148
-
149
-
150
-
151
-
152
-
153
-
154
-
155
-
156
-
157
-
158
-
159
-
160
-
161
-
162
-
163
-
164
-
165
-
166
-
167
-
168
-
169
-
170
-
171
-
172
-
173
-
174
-
175
-
176
-
177
-
178
-
179
-
180
-
181
-
182
-
183
 |
 |

FORM 10-K
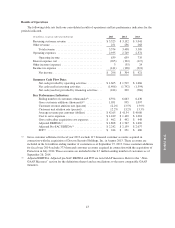
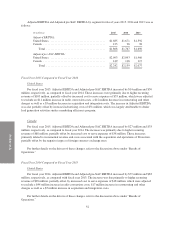
Year Ended September 25, 2015 Compared with Year Ended September 26, 2014
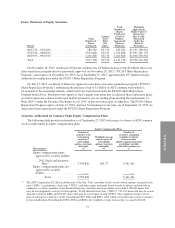
Revenue
The increase in consolidated revenue was attributable to the following:
(in millions) 2015 2014 $ Change % Change
Recurring customer revenue ....................... $3,323 $3,152 $171 5.4%
Other revenue ................................... 251 256 (5) (2.0)%
Total consolidated revenue .................... $3,574 $3,408 $166 4.9%
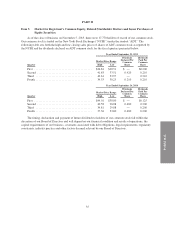
Revenue by segment for fiscal year 2015 and fiscal year 2014 was as follows:
(in millions) 2015 2014 $ Change % Change
United States ................................... $3,294 $3,206 $ 88 2.7%
Canada ........................................ 280 202 78 38.6%
Total consolidated revenue .................... $3,574 $3,408 $166 4.9%
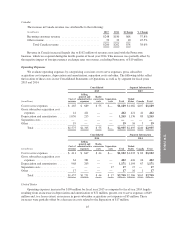
United States
The increase in United States revenue was attributable to the following:
(in millions) 2015 2014 $ Change % Change
Recurring customer revenue ....................... $3,075 $2,972 $103 3.5%
Other revenue ................................... 219 234 (15) (6.4)%
Total United States revenue .................... $3,294 $3,206 $ 88 2.7%
Revenue in the United States increased as a result of growth in recurring customer revenue for our
residential and business customers of $103 million, which was partially offset by a decrease in other revenue.
Recurring customer revenue increased as a result of higher average revenue per customer. Average revenue per
customer increased by $1.74 or 4.0%, to $44.79 as of September 25, 2015 as compared to $43.05 as of
September 26, 2014. This increase was primarily due to the addition of new customers at higher rates, largely
driven by an increase in ADT Pulse®customers as compared to total customer additions, as well as price
escalations on our existing customer base.
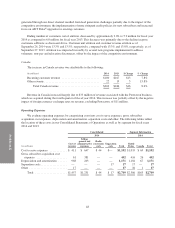
Gross customer additions increased by 4.4% to 981 thousand during fiscal year 2015 as compared to
940 thousand during fiscal year 2014. This increase was due to greater direct and dealer channel production. The
increase in customer accounts generated through our direct channel resulted primarily from greater phone sales,
increased self-generated business and improved close rates. The increase in our dealer channel production was
primarily due to a higher number of customers generated from our existing dealers.
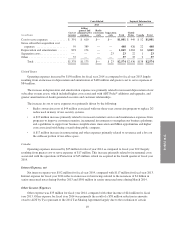
Ending number of customers, net of attrition, for fiscal year 2015 remained relatively flat at 5.9 million as
compared to fiscal year 2014. Both customer unit attrition and customer revenue attrition as of September 25,
2015 were 12.3%, compared with 13.3% and 13.5%, respectively, as of September 26, 2014. Attrition was
impacted favorably by several programs implemented to strengthen resale efforts and address non-pay
disconnects.
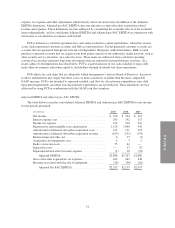
The reduction in other revenue was primarily due to a decrease in outright system sales of $31 million,
which was mainly driven by a mix shift from video equipment sales to ADT-owned hosted video solutions to our
business customers, resulting in higher deferred revenue and lower current period installation revenue. This
decrease was partially offset by increased amortization of deferred subscriber acquisition revenue of $13 million.
44