ADT 2015 Annual Report Download - page 52
Download and view the complete annual report
Please find page 52 of the 2015 ADT annual report below. You can navigate through the pages in the report by either clicking on the pages listed below, or by using the keyword search tool below to find specific information within the annual report.-
 1
1 -
2
-
3
-
4
-
5
-
6
-
7
-
8
-
9
-
10
-
11
-
12
-
13
-
14
-
15
-
16
-
17
-
18
-
19
-
20
-
21
-
22
-
23
-
24
-
25
-
26
-
27
-
28
-
29
-
30
-
31
-
32
-
33
-
34
-
35
-
36
-
37
-
38
-
39
-
40
-
41
-
 42
42 -
 43
43 -
 44
44 -
 45
45 -
 46
46 -
 47
47 -
 48
48 -
 49
49 -
 50
50 -
 51
51 -
 52
52 -
 53
53 -
 54
54 -
 55
55 -
 56
56 -
 57
57 -
 58
58 -
 59
59 -
 60
60 -
 61
61 -
 62
62 -
63
-
64
-
65
-
66
-
67
-
68
-
69
-
70
-
71
-
72
-
73
-
74
-
75
-
76
-
77
-
78
-
79
-
80
-
81
-
82
-
83
-
84
-
85
-
86
-
87
-
88
-
89
-
90
-
91
-
92
-
93
-
94
-
95
-
96
-
97
-
98
-
99
-
100
-
101
-
102
-
103
-
104
-
105
-
106
-
107
-
108
-
109
-
110
-
111
-
112
-
113
-
114
-
115
-
116
-
117
-
118
-
119
-
120
-
121
-
122
-
123
-
124
-
125
-
126
-
127
-
128
-
129
-
130
-
131
-
132
-
133
-
134
-
135
-
136
-
137
-
138
-
139
-
140
-
141
-
142
-
143
-
144
-
145
-
146
-
147
-
148
-
149
-
150
-
151
-
152
-
153
-
154
-
155
-
156
-
157
-
158
-
159
-
160
-
161
-
162
-
163
-
164
-
165
-
166
-
167
-
168
-
169
-
170
-
171
-
172
-
173
-
174
-
175
-
176
-
177
-
178
-
179
-
180
-
181
-
182
-
183
 |
 |

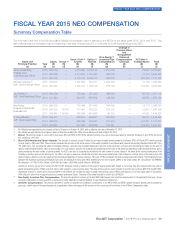
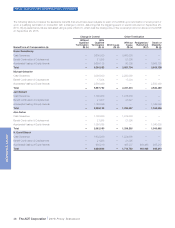
FISCAL YEAR 2015 NEO COMPENSATION—CONTINUED
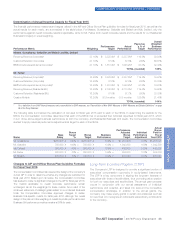
(1) Amounts reported in columns (d) through (f) represent potential annual performance bonuses that the NEOs could have earned under the Company’s Officer Bonus Plan for fiscal year 2015.
The range of potential payouts is based upon the guideline formula the Compensation Committee uses to exercise its available “negative discretion” under the plan. The Compensation
Committee established a maximum payout of 200% of target. Threshold amounts assume minimum performance levels are achieved with respect to each performance measure.
(2) Amounts reported in columns (g) through (i) represent potential share payouts with respect to PSU awards that were made in connection with the fiscal year 2015 long-term incentive grant.
PSU awards will vest at the end of the three-year performance period, based upon the Company’s performance against its EBITDA and TSR targets. The threshold amounts shown above
reflect the number of shares which would be delivered assuming that threshold attainment was met for the performance metrics. The maximum amounts shown assume maximum attainment
against performance metrics. PSUs accrue dividend equivalent units, but these equivalents are ultimately delivered to the recipient only to the extent that the underlying awards vest based
upon performance.
(3) Amounts reported in column (m) show the grant date fair value of the Stock Option, RSU and PSU awards granted to the NEOs. These amounts represent the fair value of the entire amount of
the award calculated in accordance with ASC Topic 718, excluding the effect of estimated forfeitures. For grants of Stock Options, amounts are computed by multiplying the fair value of the
award (as determined under the Black-Scholes option pricing model) by the total number of options granted. For grants of RSUs, fair value is computed by multiplying the total number of
shares subject to the award by the closing price of the Company’s common stock on the date of grant. For grants of PSUs, fair value is based on a model that considers the closing price of
the Company’s common stock on the date of grant, the range of shares subject to such stock award, and the estimated probabilities of vesting outcomes. The value of PSUs included in the
table assumes target performance. However, the actual number of shares that will be delivered with respect to the PSUs will be determined based on performance through the end of the three-
year performance period.
(4) Amounts represent grants of PSUs, RSUs and/or Stock Options with respect to the Company’s annual long-term incentive plan.
(5) PSUs which vest subject to the Company’s EBITDA performance relative to target.
(6) PSUs which vest subject to the Company’s TSR performance relative to target.
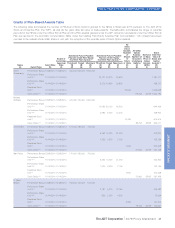
The Company made its annual grant of equity for fiscal year 2015 in November 2014. The annual award for each of the NEOs consisted of a mix
of PSUs, RSUs and Stock Options. For Stock Options, the exercise price equals the closing price of the Company’s common stock on the date
of grant. Stock Options granted as part of the annual award process generally vest in equal installments over a period of four years. Each option
holder has 10 years to exercise his or her Stock Option from the date of grant, unless forfeited earlier. PSUs generally vest at the end of a three-
year performance period, with the number of shares delivered dependent on the achievement of applicable performance criteria. Anywhere
between zero and 200% of the target number of shares may be delivered based on performance. PSUs generally accrue dividend equivalent
units, which are subject to the same performance conditions applicable to the underlying award, but do not carry voting rights. RSUs granted as
part of the annual award process generally vest in equal installments over four years, accrue dividend equivalent units subject to the same
vesting restrictions as the underlying award, and do not carry voting rights.
42 The ADT Corporation 2016 Proxy Statement
PROXY STATEMENT