ADT 2015 Annual Report Download - page 112
Download and view the complete annual report
Please find page 112 of the 2015 ADT annual report below. You can navigate through the pages in the report by either clicking on the pages listed below, or by using the keyword search tool below to find specific information within the annual report.-
 1
1 -
2
-
3
-
4
-
5
-
6
-
7
-
8
-
9
-
10
-
11
-
12
-
13
-
14
-
15
-
16
-
17
-
18
-
19
-
20
-
21
-
22
-
23
-
24
-
25
-
26
-
27
-
28
-
29
-
30
-
31
-
32
-
33
-
34
-
35
-
36
-
37
-
38
-
39
-
40
-
41
-
42
-
43
-
44
-
45
-
46
-
47
-
48
-
49
-
50
-
51
-
52
-
53
-
54
-
55
-
56
-
57
-
58
-
59
-
60
-
61
-
62
-
63
-
64
-
65
-
66
-
67
-
68
-
69
-
70
-
71
-
72
-
73
-
74
-
75
-
76
-
77
-
78
-
79
-
80
-
81
-
82
-
83
-
84
-
85
-
86
-
87
-
88
-
89
-
90
-
91
-
92
-
93
-
94
-
95
-
96
-
97
-
98
-
99
-
100
-
101
-
 102
102 -
 103
103 -
 104
104 -
 105
105 -
 106
106 -
 107
107 -
 108
108 -
 109
109 -
 110
110 -
 111
111 -
 112
112 -
 113
113 -
 114
114 -
 115
115 -
 116
116 -
 117
117 -
 118
118 -
 119
119 -
 120
120 -
 121
121 -
 122
122 -
123
-
124
-
125
-
126
-
127
-
128
-
129
-
130
-
131
-
132
-
133
-
134
-
135
-
136
-
137
-
138
-
139
-
140
-
141
-
142
-
143
-
144
-
145
-
146
-
147
-
148
-
149
-
150
-
151
-
152
-
153
-
154
-
155
-
156
-
157
-
158
-
159
-
160
-
161
-
162
-
163
-
164
-
165
-
166
-
167
-
168
-
169
-
170
-
171
-
172
-
173
-
174
-
175
-
176
-
177
-
178
-
179
-
180
-
181
-
182
-
183
 |
 |

FORM 10-K
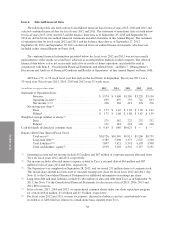
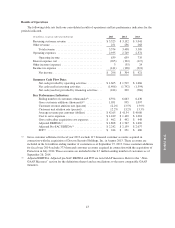
Item 6. Selected Financial Data.
The following table sets forth selected consolidated financial data for fiscal years 2015, 2014 and 2013 and
selected combined financial data for fiscal years 2012 and 2011. The statement of operations data set forth below
for fiscal years 2015, 2014 and 2013 and the balance sheet data as of September 25, 2015 and September 26,
2014 are derived from our audited financial statements included elsewhere in this Annual Report. The statement
of operations data for fiscal years 2012 and 2011 and the balance sheet data as of September 27, 2013,
September 28, 2012 and September 30, 2011 are derived from our audited financial statements which are not
included in this Annual Report on Form 10-K.
The combined financial information presented below for fiscal years 2012 and 2011 was not necessarily
representative of the results we could have achieved as an independent, publicly-traded company. The selected
financial data below is also not necessarily indicative of results of future operations and should be read in
conjunction with Item 8. “Consolidated Financial Statements and related Notes” and Item 7. “Management’s
Discussion and Analysis of Financial Condition and Results of Operations” of this Annual Report on Form 10-K.
ADT has a 52- or 53-week fiscal year that ends on the last Friday in September. Fiscal year 2011 was a
53-week year. Fiscal years 2015, 2014, 2013 and 2012 were 52-week years.
(in millions, except per share data) 2015 2014 2013 2012 2011
Statement of Operations Data:
Revenue .................................... $ 3,574 $ 3,408 $3,309 $3,228 $3,110
Operating income(1) ........................... 639 659 735 722 693
Net income(1)(2)(6) ............................. 296 304 421 394 376
Net income per share(3):
Basic ....................................... $ 1.73 $ 1.67 $ 1.90 $ 1.70 $ 1.62
Diluted ..................................... $ 1.72 $ 1.66 $ 1.88 $ 1.67 $ 1.59
Weighted average number of shares(3):
Basic ....................................... 171 182 222 232 232
Diluted ..................................... 172 183 224 236 236
Cash dividends declared per common share ................ $ 0.63 $ 0.80 $0.625 $ — $ —
Balance Sheet Data (End of Fiscal Year):
Total assets(6) ................................ $10,726 $10,549 $9,913 $9,260 $8,739
Long-term debt(4) ............................. 5,389 5,096 3,373 2,525 1,506
Total liabilities(4)(6) ............................ 7,807 7,421 5,591 4,103 3,508
Total stockholders’ equity(5) ..................... 2,919 3,128 4,322 5,157 5,231
(1) Operating income and net income include $52 million and $67 million of corporate expense allocated from
Tyco for fiscal years 2012 and 2011, respectively.
(2) Net income includes allocated interest expense related to Tyco’s external debt of $64 million and $87
million for fiscal years 2012 and 2011, respectively.
(3) The Separation was completed on September 28, 2012, and we issued 231 million shares of common stock.
This initial share amount has been used to calculate earnings per share for fiscal years 2012 and 2011. See
Note 11 to the Consolidated Financial Statements for additional information on earnings per share.
(4) Long-term debt and total liabilities include $1,482 million of allocated debt from Tyco as of September 30,
2011. See Note 5 to the Consolidated Financial Statements for discussion of fiscal 2015, 2014, 2013 and
2012 debt issuances.
(5) In fiscal years 2015, 2014 and 2013, we repurchased common shares under our share repurchase program
for a total of $324 million, $1.4 billion and $1.3 billion, respectively.
(6) For fiscal years 2012 and 2011, income tax expense, deferred tax balances and tax carryforwards were
recorded as if ADT filed tax returns on a stand-alone basis separate from Tyco.
38