ADT 2015 Annual Report Download - page 123
Download and view the complete annual report
Please find page 123 of the 2015 ADT annual report below. You can navigate through the pages in the report by either clicking on the pages listed below, or by using the keyword search tool below to find specific information within the annual report.-
 1
1 -
2
-
3
-
4
-
5
-
6
-
7
-
8
-
9
-
10
-
11
-
12
-
13
-
14
-
15
-
16
-
17
-
18
-
19
-
20
-
21
-
22
-
23
-
24
-
25
-
26
-
27
-
28
-
29
-
30
-
31
-
32
-
33
-
34
-
35
-
36
-
37
-
38
-
39
-
40
-
41
-
42
-
43
-
44
-
45
-
46
-
47
-
48
-
49
-
50
-
51
-
52
-
53
-
54
-
55
-
56
-
57
-
58
-
59
-
60
-
61
-
62
-
63
-
64
-
65
-
66
-
67
-
68
-
69
-
70
-
71
-
72
-
73
-
74
-
75
-
76
-
77
-
78
-
79
-
80
-
81
-
82
-
83
-
84
-
85
-
86
-
87
-
88
-
89
-
90
-
91
-
92
-
93
-
94
-
95
-
96
-
97
-
98
-
99
-
100
-
101
-
102
-
103
-
104
-
105
-
106
-
107
-
108
-
109
-
110
-
111
-
112
-
 113
113 -
 114
114 -
 115
115 -
 116
116 -
 117
117 -
 118
118 -
 119
119 -
 120
120 -
 121
121 -
 122
122 -
 123
123 -
 124
124 -
 125
125 -
 126
126 -
 127
127 -
 128
128 -
 129
129 -
 130
130 -
 131
131 -
 132
132 -
 133
133 -
134
-
135
-
136
-
137
-
138
-
139
-
140
-
141
-
142
-
143
-
144
-
145
-
146
-
147
-
148
-
149
-
150
-
151
-
152
-
153
-
154
-
155
-
156
-
157
-
158
-
159
-
160
-
161
-
162
-
163
-
164
-
165
-
166
-
167
-
168
-
169
-
170
-
171
-
172
-
173
-
174
-
175
-
176
-
177
-
178
-
179
-
180
-
181
-
182
-
183
 |
 |

FORM 10-K
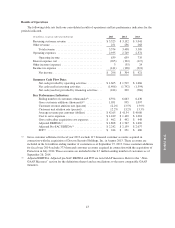
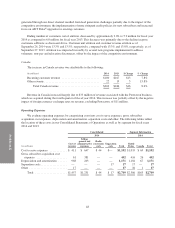
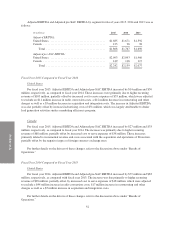
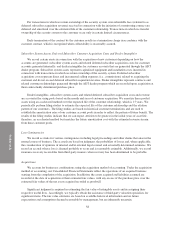
Consolidated Segment Information
2013 2013
(in millions)
Cost of
revenue
Selling,
general and
administrative
expenses
Radio
conversion
costs
Separation
costs Total
United
States Canada Total
Cost to serve expenses ............ $ 391 $ 610 $— $— $1,001 $ 949 $ 52 $1,001
Gross subscriber acquisition cost
expenses ..................... 59 389 — — 448 426 22 448
Depreciation and amortization ...... 891 174 — — 1,065 1,004 61 1,065
Separation costs .................. — — — 23 23 22 1 23
Other .......................... 37 — — — 37 35 2 37
Total ...................... $1,378 $1,173 $— $ 23 $2,574 $2,436 $138 $2,574
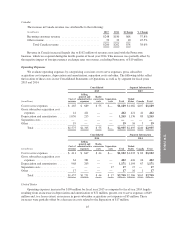
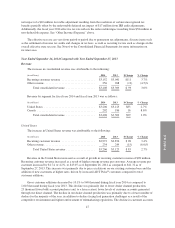
United States
Operating expenses increased by $150 million for fiscal year 2014 as compared to fiscal year 2013 largely
resulting from an increase in depreciation and amortization of $100 million and greater cost to serve expenses of
$84 million.
The increase in depreciation and amortization expense was primarily related to increased depreciation of our
subscriber system assets, which included higher costs associated with ADT Pulse®additions and upgrades, and
greater amortization of dealer generated accounts and customer relationships.
The increase in cost to serve expenses was primarily driven by the following:
• Radio conversion costs of $44 million associated with our three-year conversion program to replace 2G
radios used in many of our security systems.
• A $23 million increase primarily related to increased customer service and maintenance expenses from
programs to improve customer retention, incremental investments to strengthen our business platforms
and capabilities to support our business simplification, innovation and M&A opportunities and higher
costs associated with being a stand-alone public company.
• A $17 million increase in restructuring and other expenses primarily related to severance and a loss on
the sublease portion of our office space.
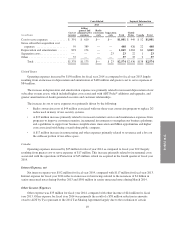
Canada
Operating expenses increased by $25 million for fiscal year 2014 as compared to fiscal year 2013 largely
resulting from greater cost to serve expenses of $17 million. This increase primarily related to incremental costs
associated with the operations of Protectron of $15 million, which we acquired in the fourth quarter of fiscal year
2014.
Interest Expense, net
Net interest expense was $192 million for fiscal year 2014, compared with $117 million for fiscal year 2013.
Interest expense for fiscal year 2014 reflects an increase in borrowings related to the issuances of $1 billion in
senior unsecured notes during October 2013 and $500 million in senior unsecured notes during March 2014.
Other Income (Expense)
Other expense was $35 million for fiscal year 2014, compared with other income of $24 million for fiscal
year 2013. Other expense for fiscal year 2014 was primarily the result of a $38 million reduction in amounts
owed to ADT by Tyco pursuant to the 2012 Tax Sharing Agreement largely due to the resolution of certain
49