ADT 2015 Annual Report Download - page 38
Download and view the complete annual report
Please find page 38 of the 2015 ADT annual report below. You can navigate through the pages in the report by either clicking on the pages listed below, or by using the keyword search tool below to find specific information within the annual report.-
 1
1 -
2
-
3
-
4
-
5
-
6
-
7
-
8
-
9
-
10
-
11
-
12
-
13
-
14
-
15
-
16
-
17
-
18
-
19
-
20
-
21
-
22
-
23
-
24
-
25
-
26
-
27
-
 28
28 -
 29
29 -
 30
30 -
 31
31 -
 32
32 -
 33
33 -
 34
34 -
 35
35 -
 36
36 -
 37
37 -
 38
38 -
 39
39 -
 40
40 -
 41
41 -
 42
42 -
 43
43 -
 44
44 -
 45
45 -
 46
46 -
 47
47 -
 48
48 -
49
-
50
-
51
-
52
-
53
-
54
-
55
-
56
-
57
-
58
-
59
-
60
-
61
-
62
-
63
-
64
-
65
-
66
-
67
-
68
-
69
-
70
-
71
-
72
-
73
-
74
-
75
-
76
-
77
-
78
-
79
-
80
-
81
-
82
-
83
-
84
-
85
-
86
-
87
-
88
-
89
-
90
-
91
-
92
-
93
-
94
-
95
-
96
-
97
-
98
-
99
-
100
-
101
-
102
-
103
-
104
-
105
-
106
-
107
-
108
-
109
-
110
-
111
-
112
-
113
-
114
-
115
-
116
-
117
-
118
-
119
-
120
-
121
-
122
-
123
-
124
-
125
-
126
-
127
-
128
-
129
-
130
-
131
-
132
-
133
-
134
-
135
-
136
-
137
-
138
-
139
-
140
-
141
-
142
-
143
-
144
-
145
-
146
-
147
-
148
-
149
-
150
-
151
-
152
-
153
-
154
-
155
-
156
-
157
-
158
-
159
-
160
-
161
-
162
-
163
-
164
-
165
-
166
-
167
-
168
-
169
-
170
-
171
-
172
-
173
-
174
-
175
-
176
-
177
-
178
-
179
-
180
-
181
-
182
-
183
 |
 |

COMPENSATION OF EXECUTIVE OFFICERS—CONTINUED
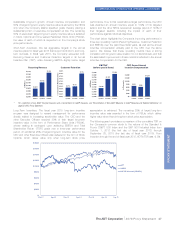
The above graph assumes the following:
(1) $100 invested at the close of business on October 1, 2012, in
ADT common stock, the S&P 500 Index and the S&P 500
Industrial Index.
(2) The cumulative total return assumes reinvestment of dividends.
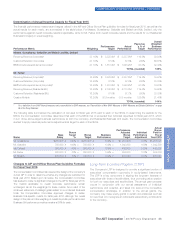
In November 2012, the Company granted PSUs to certain
employees (including Messrs. Gursahaney and Bleisch) as a
component of their annual long-term incentive award. The 3-year
performance period for these awards ended on September 25,
2015, and the earned number of PSUs vested on November 30,
2015, which was the third anniversary of the grant date. Based on
the results achieved by the Company shown in the table below, the
number of PSUs earned was 35% of the target number of PSUs
granted. This indicates alignment of pay and performance.
Metric Weighting Target Actual
Results Payout as
% of Target
Recurring Revenue Growth (Compound Annual Growth Rate or CAGR) 60% 6.8% 5.1% 57.8%
Adjusted Free Cash Flow Growth (CAGR) 40% 7.7% 1.1% 0%
Total Payout (rounded) 35%
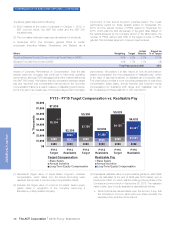
Impact of Company Performance on Compensation. Over the last
several years the Company has continued to have solid operating
performance, although TSR has lagged behind the market (defined as
the S&P 500 Index). We believe that the comparison between target
pay and “reported” pay (compensation as reported in the Summary
Compensation Table) is a useful measure of assessing performance,
but is only part of an overall view of how pay is aligned with Company
performance. We believe it is also helpful to look at performance-
based compensation from the perspective of “realizable pay,” which
is the value of pay that is earned or realizable as of a specific date.
The chart below provides a more complete perspective of total direct
compensation (base salary, annual incentive and long-term equity
compensation) by illustrating both target and “realizable” pay for
Mr. Gursahaney for fiscal years 2013, 2014 and 2015.
$900 $900 $900$900 $900 $900
$900 $900 $900
$693 $630 $1,251
$5,250
(1) (2)
$7,050
Target Compensation Realizable Pay
$3,750 $4,125
$993 $1,308
$2,481
$0
$1,000
$2,000
$3,000
$4,000
$5,000
$6,000
$7,000
$8,000
FY13
Target
FY13
Realizable
FY14
Target
FY14
Realizable
FY15
Target
FY15
Realizable
In Thousands
FY13 - FY15 Target Compensation vs. Realizable Pay
Base Salary
Annual Incentive
Long-Term Equity Compensation
Base Salary
Annual Incentive
Long-Term Equity Compensation
$2,586
$5,550
$2,838
$5,925
$4,632
(3)
(1) (1)
(3)
(3)
(1) Represents target value of equity-based long-term incentive
compensation, which differs from the actual accounting value
delivered (as reported in the Summary Compensation Table).
(2) Includes the target value of one-time Founders’ Award equity
grants made in recognition of the Company becoming a
standalone, publicly-traded company.
(3) Represents realizable value of equity awards granted in each fiscal
year, as calculated at the end of fiscal year 2015 based upon a
stock price of $30.70, which was the closing price per share of the
Company’s common stock on September 25, 2015. The realizable
value of each type of equity awarded is calculated as follows:
•Stock Options are valued based upon the amount, if any, that
the Company’s common stock price per share exceeds the
exercise price per share of the options.
28 The ADT Corporation 2016 Proxy Statement
PROXY STATEMENT