ADT 2015 Annual Report Download - page 126
Download and view the complete annual report
Please find page 126 of the 2015 ADT annual report below. You can navigate through the pages in the report by either clicking on the pages listed below, or by using the keyword search tool below to find specific information within the annual report.-
 1
1 -
2
-
3
-
4
-
5
-
6
-
7
-
8
-
9
-
10
-
11
-
12
-
13
-
14
-
15
-
16
-
17
-
18
-
19
-
20
-
21
-
22
-
23
-
24
-
25
-
26
-
27
-
28
-
29
-
30
-
31
-
32
-
33
-
34
-
35
-
36
-
37
-
38
-
39
-
40
-
41
-
42
-
43
-
44
-
45
-
46
-
47
-
48
-
49
-
50
-
51
-
52
-
53
-
54
-
55
-
56
-
57
-
58
-
59
-
60
-
61
-
62
-
63
-
64
-
65
-
66
-
67
-
68
-
69
-
70
-
71
-
72
-
73
-
74
-
75
-
76
-
77
-
78
-
79
-
80
-
81
-
82
-
83
-
84
-
85
-
86
-
87
-
88
-
89
-
90
-
91
-
92
-
93
-
94
-
95
-
96
-
97
-
98
-
99
-
100
-
101
-
102
-
103
-
104
-
105
-
106
-
107
-
108
-
109
-
110
-
111
-
112
-
113
-
114
-
115
-
 116
116 -
 117
117 -
 118
118 -
 119
119 -
 120
120 -
 121
121 -
 122
122 -
 123
123 -
 124
124 -
 125
125 -
 126
126 -
 127
127 -
 128
128 -
 129
129 -
 130
130 -
 131
131 -
 132
132 -
 133
133 -
 134
134 -
 135
135 -
 136
136 -
137
-
138
-
139
-
140
-
141
-
142
-
143
-
144
-
145
-
146
-
147
-
148
-
149
-
150
-
151
-
152
-
153
-
154
-
155
-
156
-
157
-
158
-
159
-
160
-
161
-
162
-
163
-
164
-
165
-
166
-
167
-
168
-
169
-
170
-
171
-
172
-
173
-
174
-
175
-
176
-
177
-
178
-
179
-
180
-
181
-
182
-
183
 |
 |

FORM 10-K
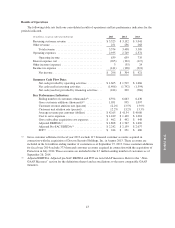
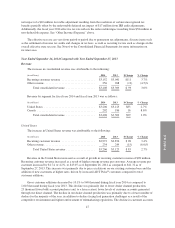
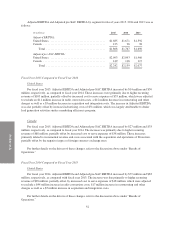
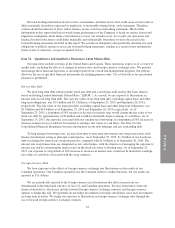
Adjusted EBITDA and Adjusted pre-SAC EBITDA by segment for fiscal years 2015, 2014 and 2013 was as
follows:
(in millions) 2015 2014 2013
Adjusted EBITDA:
United States ...................................... $1,685 $1,671 $1,592
Canada ........................................... 123 96 98
Total ......................................... $1,808 $1,767 $1,690
Adjusted pre-SAC EBITDA:
United States ...................................... $2,093 $2,043 $1,960
Canada ........................................... 149 116 117
Total ......................................... $2,242 $2,159 $2,077
Fiscal Year 2015 Compared to Fiscal Year 2014
United States
For fiscal year 2015, Adjusted EBITDA and Adjusted pre-SAC EBITDA increased by $14 million and $50
million, respectively, as compared to fiscal year 2014. These increases were primarily due to higher recurring
revenue of $103 million, partially offset by increased cost to serve expenses of $55 million, which were adjusted
to exclude an $11 million increase in radio conversion costs, a $12 million decrease in restructuring and other
charges as well as a $5 million decrease in acquisition and integration costs. The increase in Adjusted EBITDA
was also partially offset by increased advertising costs of $31 million, which was largely attributable to dealer
lead generation activities under a marketing efficiency program.
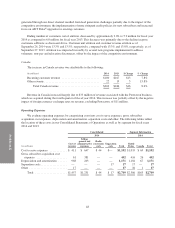
Canada
For fiscal year 2015, Adjusted EBITDA and Adjusted pre-SAC EBITDA increased by $27 million and $33
million, respectively, as compared to fiscal year 2014. The increase was primarily due to higher recurring
revenue of $68 million, partially offset by increased cost to serve expenses of $38 million. These increases
primarily related to incremental revenue and costs associated with the acquisition and operations of Protectron,
partially offset by the negative impact of foreign currency exchange rates.
For further details on the drivers of these changes, refer to the discussion above under “Results of
Operations.”
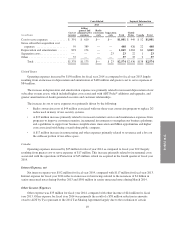
Fiscal Year 2014 Compared to Fiscal Year 2013
United States
For fiscal year 2014, Adjusted EBITDA and Adjusted pre-SAC EBITDA increased by $79 million and $83
million, respectively, as compared with fiscal year 2013. The increase was due primarily to higher recurring
revenue of $98 million, partially offset by increased cost to serve expenses of $18 million, which were adjusted
to exclude a $44 million increase in radio conversion costs, $17 million increase in restructuring and other
charges as well as a $5 million increase in acquisition and integration costs.
For further details on the drivers of these changes, refer to the discussion above under “Results of
Operations.”
52