ADT 2015 Annual Report Download - page 51
Download and view the complete annual report
Please find page 51 of the 2015 ADT annual report below. You can navigate through the pages in the report by either clicking on the pages listed below, or by using the keyword search tool below to find specific information within the annual report.-
 1
1 -
2
-
3
-
4
-
5
-
6
-
7
-
8
-
9
-
10
-
11
-
12
-
13
-
14
-
15
-
16
-
17
-
18
-
19
-
20
-
21
-
22
-
23
-
24
-
25
-
26
-
27
-
28
-
29
-
30
-
31
-
32
-
33
-
34
-
35
-
36
-
37
-
38
-
39
-
40
-
 41
41 -
 42
42 -
 43
43 -
 44
44 -
 45
45 -
 46
46 -
 47
47 -
 48
48 -
 49
49 -
 50
50 -
 51
51 -
 52
52 -
 53
53 -
 54
54 -
 55
55 -
 56
56 -
 57
57 -
 58
58 -
 59
59 -
 60
60 -
 61
61 -
62
-
63
-
64
-
65
-
66
-
67
-
68
-
69
-
70
-
71
-
72
-
73
-
74
-
75
-
76
-
77
-
78
-
79
-
80
-
81
-
82
-
83
-
84
-
85
-
86
-
87
-
88
-
89
-
90
-
91
-
92
-
93
-
94
-
95
-
96
-
97
-
98
-
99
-
100
-
101
-
102
-
103
-
104
-
105
-
106
-
107
-
108
-
109
-
110
-
111
-
112
-
113
-
114
-
115
-
116
-
117
-
118
-
119
-
120
-
121
-
122
-
123
-
124
-
125
-
126
-
127
-
128
-
129
-
130
-
131
-
132
-
133
-
134
-
135
-
136
-
137
-
138
-
139
-
140
-
141
-
142
-
143
-
144
-
145
-
146
-
147
-
148
-
149
-
150
-
151
-
152
-
153
-
154
-
155
-
156
-
157
-
158
-
159
-
160
-
161
-
162
-
163
-
164
-
165
-
166
-
167
-
168
-
169
-
170
-
171
-
172
-
173
-
174
-
175
-
176
-
177
-
178
-
179
-
180
-
181
-
182
-
183
 |
 |

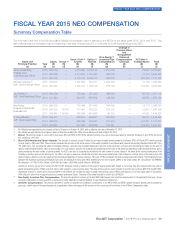
FISCAL YEAR 2015 NEO COMPENSATION—CONTINUED
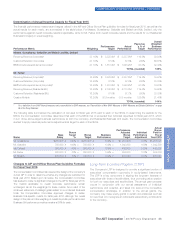
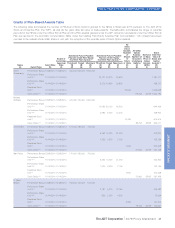
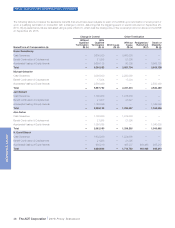
Grants of Plan-Based Awards Table
The following table summarizes the number of RSUs and Stock Options granted to the NEOs in fiscal year 2015 pursuant to The ADT 2012
Stock and Incentive Plan (the “SIP”), as well as the grant date fair value of these awards. The table also summarizes the range of potential
payouts for the NEOs under the Officer Bonus Plan and the PSU awards granted under the SIP. Actual bonus awards under the Officer Bonus
Plan are reported in the Summary Compensation Table under the heading “Non-Equity Incentive Plan Compensation.” All numbers have been
rounded to the nearest whole dollar, share or unit, with the exception of the exercise price of Stock Option awards.
Board or
Committee
Approval
Date
(c)
Estimated Future Possible
Payouts Under Non-Equity
Incentive Plan Awards (1)
Estimated Future Possible
Payouts Under Equity
Incentive Plan Awards (2)
All
Other
Stock
Awards:
Number
of
Shares
of
Stock
or Units
(#)
(j)
All Other
Option
Awards:
Number of
Securities
Underlying
Options
(#)
(k)
Exercise
or Base
Price of
Option
Awards
($/Sh)
(l)
Grant
Date Fair
Value of
Stock and
Option
Awards (3)
($)
(m)
Name
(a) Award Type Grant Date
(b)
Threshold
($)
(d)
Target
($)
(e)
Maximum
($)
(f)
Threshold
(#)
(g)
Target
(#)
(h)
Maximum
(#)
(i)
Naren
Gursahaney
Performance Bonus 12/08/2014 12/08/2014 450,000 900,000 1,800,000
Performance Share
Unit (4)(5) 11/14/2014 11/14/2014 20,137 40,275 80,550 1,291,217
Performance Share
Unit (4)(6) 11/14/2014 11/14/2014 5,370 13,425 26,850 458,717
Restricted Stock
Unit (4) 11/14/2014 11/14/2014 28,600 1,029,028
Stock Option (4) 11/14/2014 11/14/2014 119,400 35.98 1,004,154
Michael
Geltzeiler Performance Bonus 12/08/2014 12/08/2014 375,000 750,000 1,500,000
Performance Share
Unit (4)(5) 11/14/2014 11/14/2014 10,050 20,100 40,200 644,406
Performance Share
Unit (4)(6) 11/14/2014 11/14/2014 2,680 6,700 13,400 228,932
Restricted Stock
Unit (4) 11/14/2014 11/14/2014 14,300 514,514
Stock Option (4) 11/14/2014 11/14/2014 59,700 35.98 502,077
Jerri DeVard Performance Bonus 12/08/2014 12/08/2014 175,000 350,000 700,000
Performance Share
Unit (4)(5) 11/14/2014 11/14/2014 5,362 10,725 21,450 343,844
Performance Share
Unit (4)(6) 11/14/2014 11/14/2014 1,430 3,575 7,150 122,154
Restricted Stock
Unit (4) 11/14/2014 11/14/2014 7,600 273,448
Stock Option (4) 11/14/2014 11/14/2014 31,800 35.98 267,438
Alan Ferber Performance Bonus 12/08/2014 12/08/2014 175,000 350,000 700,000
Performance Share
Unit (4)(5) 11/14/2014 11/14/2014 5,362 10,725 21,450 343,844
Performance Share
Unit (4)(6) 11/14/2014 11/14/2014 1,430 3,575 7,150 122,154
Restricted Stock
Unit (4) 11/14/2014 11/14/2014 7,600 273,448
Stock Option (4) 11/14/2014 11/14/2014 31,800 35.98 267,438
N. David
Bleisch Performance Bonus 12/08/2014 12/08/2014 168,000 336,000 672,000
Performance Share
Unit (4)(5) 11/14/2014 11/14/2014 3,187 6,375 12,750 204,383
Performance Share
Unit (4)(6) 11/14/2014 11/14/2014 850 2,125 4,250 72,609
Restricted Stock
Unit (4) 11/14/2014 11/14/2014 4,500 161,910
Stock Option (4) 11/14/2014 11/14/2014 19,100 35.98 160,631
The ADT Corporation 2016 Proxy Statement 41
PROXY STATEMENT