ADT 2015 Annual Report Download - page 120
Download and view the complete annual report
Please find page 120 of the 2015 ADT annual report below. You can navigate through the pages in the report by either clicking on the pages listed below, or by using the keyword search tool below to find specific information within the annual report.-
 1
1 -
2
-
3
-
4
-
5
-
6
-
7
-
8
-
9
-
10
-
11
-
12
-
13
-
14
-
15
-
16
-
17
-
18
-
19
-
20
-
21
-
22
-
23
-
24
-
25
-
26
-
27
-
28
-
29
-
30
-
31
-
32
-
33
-
34
-
35
-
36
-
37
-
38
-
39
-
40
-
41
-
42
-
43
-
44
-
45
-
46
-
47
-
48
-
49
-
50
-
51
-
52
-
53
-
54
-
55
-
56
-
57
-
58
-
59
-
60
-
61
-
62
-
63
-
64
-
65
-
66
-
67
-
68
-
69
-
70
-
71
-
72
-
73
-
74
-
75
-
76
-
77
-
78
-
79
-
80
-
81
-
82
-
83
-
84
-
85
-
86
-
87
-
88
-
89
-
90
-
91
-
92
-
93
-
94
-
95
-
96
-
97
-
98
-
99
-
100
-
101
-
102
-
103
-
104
-
105
-
106
-
107
-
108
-
109
-
 110
110 -
 111
111 -
 112
112 -
 113
113 -
 114
114 -
 115
115 -
 116
116 -
 117
117 -
 118
118 -
 119
119 -
 120
120 -
 121
121 -
 122
122 -
 123
123 -
 124
124 -
 125
125 -
 126
126 -
 127
127 -
 128
128 -
 129
129 -
 130
130 -
131
-
132
-
133
-
134
-
135
-
136
-
137
-
138
-
139
-
140
-
141
-
142
-
143
-
144
-
145
-
146
-
147
-
148
-
149
-
150
-
151
-
152
-
153
-
154
-
155
-
156
-
157
-
158
-
159
-
160
-
161
-
162
-
163
-
164
-
165
-
166
-
167
-
168
-
169
-
170
-
171
-
172
-
173
-
174
-
175
-
176
-
177
-
178
-
179
-
180
-
181
-
182
-
183
 |
 |

FORM 10-K
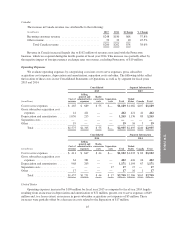
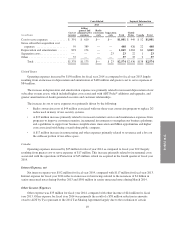
The increase in depreciation and amortization expense was primarily driven by additional depreciation
expense on subscriber system assets, which included higher costs associated with ADT Pulse®additions and
upgrades, and greater amortization of dealer generated accounts and customer relationships.
The increase in cost to serve expenses was primarily driven by the following:
• Increased costs of $47 million largely related to greater maintenance and customer service expenses
due primarily to a higher mix of ADT Pulse®customers, as well as efforts to enhance our customer
care and service response, and higher bad debt expense.
• Increased radio conversion costs of $11 million, related to a three-year conversion program for the
replacement of 2G radios used in many of our security systems which will continue to drive future
incremental costs. We expect to complete this program by the end of calendar year 2016 and anticipate
that we will incur approximately $85 million to $105 million of remaining costs in conjunction with
this program.
These increases were partially offset by a decrease in restructuring and other expenses of $12 million.
Restructuring and other expenses in fiscal year 2014 primarily related to severance and a loss on the
sublease portion of our office space.
Gross subscriber acquisition cost expenses were relatively flat and included the following:
• Increased advertising costs of $31 million, which were largely attributable to $25 million of dealer lead
generation activities under a marketing efficiency program.
• Decreased installation costs on outright system sales to our business customers of $28 million due to a
mix shift from video equipment sales to ADT-owned hosted video solutions, resulting in higher
deferred costs and lower current period installation costs.
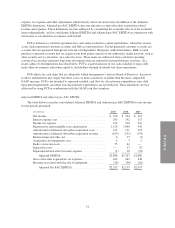
Canada
Operating expenses increased by $77 million for fiscal year 2015 as compared to fiscal year 2014 largely
resulting from greater cost to serve expenses of $38 million, an increase in depreciation and amortization of $22
million and, to a lesser extent, higher gross subscriber acquisition cost expenses of $15 million. These increases
primarily related to incremental costs associated with the acquisition and operations of Protectron, which we
acquired in the fourth quarter of fiscal year 2014, partially offset by the impact of foreign currency exchange
rates.
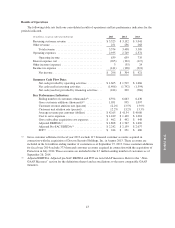
Interest Expense, net
Net interest expense is comprised primarily of interest on our long-term debt. Interest expense, net was $205
million for fiscal year 2015 compared with $192 million for fiscal year 2014. Interest expense for fiscal year
2015 reflects an increase in borrowings related to the issuance of $300 million in senior unsecured notes in
December 2014.
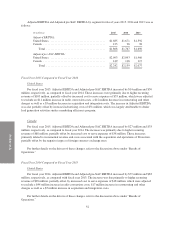
Other Income (Expense)
Other income was $3 million for fiscal year 2015, compared with other expense of $35 million for fiscal
year 2014. Other expense for fiscal year 2014 was primarily the result of a $38 million reduction in amounts
owed to ADT by Tyco pursuant to the 2012 Tax Sharing Agreement largely due to the resolution of certain
unrecognized tax benefits. See Note 6 to the Consolidated Financial Statements for more information.
Income Tax Expense
Income tax expense was $141 million for fiscal year 2015, compared with $128 million for fiscal year 2014,
and the effective tax rate increased to 32.3% from 29.6%. The effective tax rate for fiscal year 2014 reflects the
46