ADT 2015 Annual Report Download - page 125
Download and view the complete annual report
Please find page 125 of the 2015 ADT annual report below. You can navigate through the pages in the report by either clicking on the pages listed below, or by using the keyword search tool below to find specific information within the annual report.-
 1
1 -
2
-
3
-
4
-
5
-
6
-
7
-
8
-
9
-
10
-
11
-
12
-
13
-
14
-
15
-
16
-
17
-
18
-
19
-
20
-
21
-
22
-
23
-
24
-
25
-
26
-
27
-
28
-
29
-
30
-
31
-
32
-
33
-
34
-
35
-
36
-
37
-
38
-
39
-
40
-
41
-
42
-
43
-
44
-
45
-
46
-
47
-
48
-
49
-
50
-
51
-
52
-
53
-
54
-
55
-
56
-
57
-
58
-
59
-
60
-
61
-
62
-
63
-
64
-
65
-
66
-
67
-
68
-
69
-
70
-
71
-
72
-
73
-
74
-
75
-
76
-
77
-
78
-
79
-
80
-
81
-
82
-
83
-
84
-
85
-
86
-
87
-
88
-
89
-
90
-
91
-
92
-
93
-
94
-
95
-
96
-
97
-
98
-
99
-
100
-
101
-
102
-
103
-
104
-
105
-
106
-
107
-
108
-
109
-
110
-
111
-
112
-
113
-
114
-
 115
115 -
 116
116 -
 117
117 -
 118
118 -
 119
119 -
 120
120 -
 121
121 -
 122
122 -
 123
123 -
 124
124 -
 125
125 -
 126
126 -
 127
127 -
 128
128 -
 129
129 -
 130
130 -
 131
131 -
 132
132 -
 133
133 -
 134
134 -
 135
135 -
136
-
137
-
138
-
139
-
140
-
141
-
142
-
143
-
144
-
145
-
146
-
147
-
148
-
149
-
150
-
151
-
152
-
153
-
154
-
155
-
156
-
157
-
158
-
159
-
160
-
161
-
162
-
163
-
164
-
165
-
166
-
167
-
168
-
169
-
170
-
171
-
172
-
173
-
174
-
175
-
176
-
177
-
178
-
179
-
180
-
181
-
182
-
183
 |
 |

FORM 10-K
expense, tax expense and other adjustments which directly affect our net income. In addition to the Adjusted
EBITDA limitations, Adjusted pre-SAC EBITDA does not take into account subscriber acquisition related
revenue and expenses. These limitations are best addressed by considering the economic effects of the excluded
items independently, and by considering Adjusted EBITDA and Adjusted pre-SAC EBITDA in conjunction with
net income as calculated in accordance with GAAP.
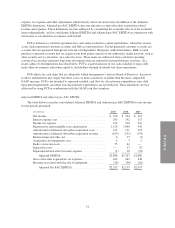
FCF is defined as cash from operations less cash outlays related to capital expenditures, subscriber system
assets, dealer generated customer accounts and bulk account purchases. Dealer generated customer accounts are
accounts that are generated through our network of independent, third-party authorized dealers. Bulk account
purchases represent accounts that we acquire from third parties outside of our authorized, dealer network, such as
other security service providers, on a selective basis. These items are subtracted from cash from operating
activities because they represent long-term investments that are required for normal business activities. As a
result, subject to the limitations described below, FCF is a useful measure of our cash available to repay debt,
make other investments and return capital to stockholders through dividends and share repurchases.
FCF adjusts for cash items that are ultimately within management’s and our Board of Directors’ discretion
to direct and therefore may imply that there is less or more cash that is available than the most comparable
GAAP measure. FCF is not intended to represent residual cash flow for discretionary expenditures since debt
repayment requirements and other non-discretionary expenditures are not deducted. These limitations are best
addressed by using FCF in combination with the GAAP cash flow numbers.
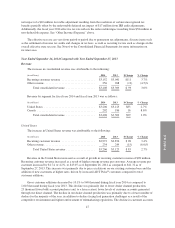
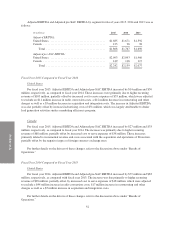
Adjusted EBITDA and Adjusted pre-SAC EBITDA
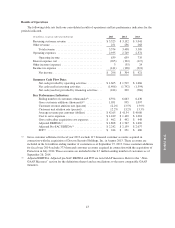
The table below reconciles consolidated Adjusted EBITDA and Adjusted pre-SAC EBITDA to net income
for the periods presented.
(in millions) 2015 2014 2013
Net income ........................................ $ 296 $ 304 $ 421
Interest expense, net ................................. 205 192 117
Income tax expense ................................. 141 128 221
Depreciation and intangible asset amortization ............ 1,124 1,040 942
Amortization of deferred subscriber acquisition costs ....... 141 131 123
Amortization of deferred subscriber acquisition revenue .... (163) (151) (135)
Restructuring and other, net ........................... 6 17 (1)
Acquisition and integration costs .......................472
Radio conversion costs ............................... 55 44 —
Separation costs .................................... — 17 23
Separation related other (income) expense ............... (1) 38 (23)
Adjusted EBITDA .............................. $1,808 $1,767 $1,690
Gross subscriber acquisition cost expenses ............... 462 442 448
Revenue associated with the sale of equipment ............ (28) (50) (61)
Adjusted Pre-SAC EBITDA ...................... $2,242 $2,159 $2,077
51