ADT 2015 Annual Report Download - page 43
Download and view the complete annual report
Please find page 43 of the 2015 ADT annual report below. You can navigate through the pages in the report by either clicking on the pages listed below, or by using the keyword search tool below to find specific information within the annual report.-
 1
1 -
2
-
3
-
4
-
5
-
6
-
7
-
8
-
9
-
10
-
11
-
12
-
13
-
14
-
15
-
16
-
17
-
18
-
19
-
20
-
21
-
22
-
23
-
24
-
25
-
26
-
27
-
28
-
29
-
30
-
31
-
32
-
 33
33 -
 34
34 -
 35
35 -
 36
36 -
 37
37 -
 38
38 -
 39
39 -
 40
40 -
 41
41 -
 42
42 -
 43
43 -
 44
44 -
 45
45 -
 46
46 -
 47
47 -
 48
48 -
 49
49 -
 50
50 -
 51
51 -
 52
52 -
 53
53 -
54
-
55
-
56
-
57
-
58
-
59
-
60
-
61
-
62
-
63
-
64
-
65
-
66
-
67
-
68
-
69
-
70
-
71
-
72
-
73
-
74
-
75
-
76
-
77
-
78
-
79
-
80
-
81
-
82
-
83
-
84
-
85
-
86
-
87
-
88
-
89
-
90
-
91
-
92
-
93
-
94
-
95
-
96
-
97
-
98
-
99
-
100
-
101
-
102
-
103
-
104
-
105
-
106
-
107
-
108
-
109
-
110
-
111
-
112
-
113
-
114
-
115
-
116
-
117
-
118
-
119
-
120
-
121
-
122
-
123
-
124
-
125
-
126
-
127
-
128
-
129
-
130
-
131
-
132
-
133
-
134
-
135
-
136
-
137
-
138
-
139
-
140
-
141
-
142
-
143
-
144
-
145
-
146
-
147
-
148
-
149
-
150
-
151
-
152
-
153
-
154
-
155
-
156
-
157
-
158
-
159
-
160
-
161
-
162
-
163
-
164
-
165
-
166
-
167
-
168
-
169
-
170
-
171
-
172
-
173
-
174
-
175
-
176
-
177
-
178
-
179
-
180
-
181
-
182
-
183
 |
 |

COMPENSATION OF EXECUTIVE OFFICERS—CONTINUED
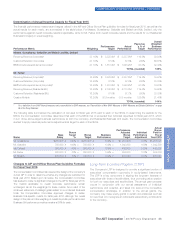
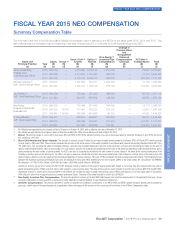
Determination of Annual Incentive Awards for Fiscal Year 2015
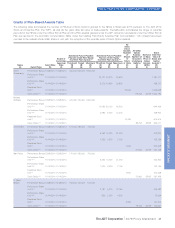
The financial performance measures and targets utilized in the AIP and Officer Bonus Plan guideline formulas for fiscal year 2015, as well as the
actual results for each metric, are summarized in the table below. For Messrs. Gursahaney, Geltzeiler and Bleisch and Ms. DeVard, only the
performance against overall corporate results is applicable, while for Mr. Ferber both overall corporate results and the results for our Residential
Business Unit apply in equal weighting.
Performance Metric Weighting Performance
Target Actual
Performance
Payout as
a%of
Target
Overall
Weighted
Business
Performance
Messrs. Gursahaney, Geltzeiler and Bleisch and Ms. DeVard
Recurring Revenue (Corporate)* 33 1/3% $ 3,325.0M $ 3,337.5M* 119.8% 39.93%
Customer Retention (Corporate) 33 1/3% 87.0% 87.8% 200% 66.67%
EBITDA before special items (Corporate)* 33 1/3% $ 1,851.0M $ 1,848.2M* 97.3% 32.43%
TOTAL (rounded) 139%
Mr. Ferber
Recurring Revenue (Corporate)* 16 2/3% $ 3,325.0M $ 3,337.5M* 119.8% 19.97%
Customer Retention (Corporate) 16 2/3% 87.0% 87.8% 200% 33.33%
EBITDA before special items (Corporate)* 16 2/3% $ 1,851.0M $ 1,848.2M* 97.3% 16.22%
Recurring Revenue (Residential BU) 16 2/3% $ 2,762.0M $ 2,773.3M 119.5% 19.92%
Customer Retention (Residential BU) 16 2/3% 87.0% 87.7% 200% 33.33%
Creation Multiple 16 2/3% 30.9 months 30.5 months 128.6% 21.43%
TOTAL (rounded) 144%
*For a definition of non-GAAP financial measures and a reconciliation to GAAP measures, see “Reconciliation of Non-GAAP Measures to GAAP Measures and Selected Definitions” on page
53 of this Proxy Statement.
The following table summarizes the calculation of bonuses for fiscal year 2015 paid to each of the NEOs. In determining the awards for the
NEOs, the Compensation Committee determined that each of the NEOs met or exceeded their individual objectives for fiscal year 2015, which
in turn drove above-target business performance at both the Company and Residential Business Unit levels. The Compensation Committee
elected to apply individual performance adjustments at target for each of the NEOs.
Name Base
Salary
Bonus
Target
%Bonus
Target Business
Performance
Performance
Adjusted
Bonus
Target
Individual
Performance
Adjustment
Actual
Bonus
Paid for
Fiscal
Year 2015
Mr. Gursahaney $900,000 X 100% = $900,000 X 139% = $1,251,000 100% $1,251,000
Mr. Geltzeiler 750,000 X 100% = 750,000 X 139% = 1,042,500 100% 1,042,500
Ms. DeVard 500,000 X 70% = 350,000 X 139% = 486,500 100% 486,500
Mr. Ferber 500,000 X 70% = 350,000 X 144% = 504,000 100% 504,000
Mr. Bleisch 480,000 X 70% = 336,000 X 139% = 467,040 100% 467,040
Changes to AIP and Officer Bonus Plan Guideline Formulas
for Fiscal Year 2016
The Compensation Committee has reviewed the design of the Company’s
current AIP in order to determine whether any changes are warranted for
fiscal year 2016. Based upon its review, the Compensation Committee
has elected to make no significant changes to the AIP for fiscal year 2016.
The metrics applicable to overall corporate performance remain
unchanged, as do the weightings for these metrics. As a result of the
continued refinement of strategic goals related to our individual Business
Units, the Compensation Committee approved changes to certain
Business Unit-specific metrics for fiscal year 2016, although the overall
design of the plan and the weighting of overall corporate performance and
Business Unit performance metrics remains at 50% for each.
Long-Term Incentive Program (“LTIP”)
The Company’s LTIP is designed to provide a significant portion of
executives’ compensation opportunity in equity-based instruments.
The LTIP is a key component in aligning the long-term interests of
executives with those of stockholders, thus promoting value creation
for both our executives and stockholders. The annual grant process
occurs in conjunction with our annual assessment of individual
performance and potential, and takes into account the competitive
compensation landscape. In addition to the annual grants, the
Company may make equity grants in certain circumstances such as
for new hires or to recognize an individual’s extraordinary contributions
to the Company.
The ADT Corporation 2016 Proxy Statement 33
PROXY STATEMENT