ADT 2015 Annual Report Download - page 117
Download and view the complete annual report
Please find page 117 of the 2015 ADT annual report below. You can navigate through the pages in the report by either clicking on the pages listed below, or by using the keyword search tool below to find specific information within the annual report.-
 1
1 -
2
-
3
-
4
-
5
-
6
-
7
-
8
-
9
-
10
-
11
-
12
-
13
-
14
-
15
-
16
-
17
-
18
-
19
-
20
-
21
-
22
-
23
-
24
-
25
-
26
-
27
-
28
-
29
-
30
-
31
-
32
-
33
-
34
-
35
-
36
-
37
-
38
-
39
-
40
-
41
-
42
-
43
-
44
-
45
-
46
-
47
-
48
-
49
-
50
-
51
-
52
-
53
-
54
-
55
-
56
-
57
-
58
-
59
-
60
-
61
-
62
-
63
-
64
-
65
-
66
-
67
-
68
-
69
-
70
-
71
-
72
-
73
-
74
-
75
-
76
-
77
-
78
-
79
-
80
-
81
-
82
-
83
-
84
-
85
-
86
-
87
-
88
-
89
-
90
-
91
-
92
-
93
-
94
-
95
-
96
-
97
-
98
-
99
-
100
-
101
-
102
-
103
-
104
-
105
-
106
-
 107
107 -
 108
108 -
 109
109 -
 110
110 -
 111
111 -
 112
112 -
 113
113 -
 114
114 -
 115
115 -
 116
116 -
 117
117 -
 118
118 -
 119
119 -
 120
120 -
 121
121 -
 122
122 -
 123
123 -
 124
124 -
 125
125 -
 126
126 -
 127
127 -
128
-
129
-
130
-
131
-
132
-
133
-
134
-
135
-
136
-
137
-
138
-
139
-
140
-
141
-
142
-
143
-
144
-
145
-
146
-
147
-
148
-
149
-
150
-
151
-
152
-
153
-
154
-
155
-
156
-
157
-
158
-
159
-
160
-
161
-
162
-
163
-
164
-
165
-
166
-
167
-
168
-
169
-
170
-
171
-
172
-
173
-
174
-
175
-
176
-
177
-
178
-
179
-
180
-
181
-
182
-
183
 |
 |

FORM 10-K
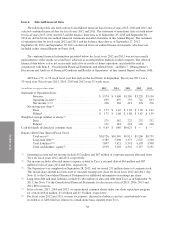
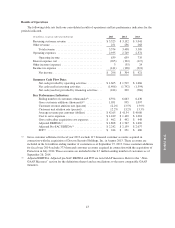
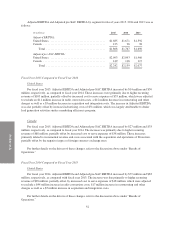
Results of Operations
The following table sets forth our consolidated results of operations and key performance indicators for the
periods indicated.
(in millions, except as otherwise indicated) 2015 2014 2013
Recurring customer revenue ........................ $3,323 $ 3,152 $ 3,041
Other revenue .................................... 251 256 268
Total revenue ................................ 3,574 3,408 3,309
Operating expenses ............................... 2,935 2,749 2,574
Operating income ............................. 639 659 735
Interest expense, net ............................... (205) (192) (117)
Other income (expense) ............................ 3 (35) 24
Income tax expense ............................... (141) (128) (221)
Net income .................................. $ 296 $ 304 $ 421
Summary Cash Flow Data:
Net cash provided by operating activities .......... $1,605 $ 1,519 $ 1,666
Net cash used in investing activities .............. (1,406) (1,792) (1,394)
Net cash (used in) provided by financing activities . . . (184) 202 (366)
Key Performance Indicators:
Ending number of customers (thousands)(1) ......... 6,594 6,663 6,430
Gross customer additions (thousands)(1) ........... 1,051 995 1,097
Customer revenue attrition rate (percent) .......... 12.2% 13.5% 13.9%
Customer unit attrition rate (percent) .............. 12.2% 13.2% 13.3%
Average revenue per customer (dollars) ........... $42.65 $ 41.54 $ 40.80
Cost to serve expenses ......................... $1,189 $ 1,102 $ 1,001
Gross subscriber acquisition cost expenses ......... $ 462 $ 442 $ 448
Adjusted EBITDA(2) ........................... $1,808 $ 1,767 $ 1,690
Adjusted Pre-SAC EBITDA(2) ................... $2,242 $ 2,159 $ 2,077
FCF(2) ...................................... $ 244 $ 251 $ 460
(1) Gross customer additions for fiscal year 2013 exclude 117 thousand customer accounts acquired in
connection with the acquisition of Devcon Security Holdings, Inc. in August 2013. These accounts are
included in the 6.4 million ending number of customers as of September 27, 2013. Gross customer additions
for fiscal year 2014 exclude 373 thousand customer accounts acquired in connection with the acquisition of
Protectron in July 2014. These accounts are included in the 6.7 million ending number of customers as of
September 26, 2014.
(2) Adjusted EBITDA, Adjusted pre-SAC EBITDA and FCF are non-GAAP measures. Refer to the “-Non-
GAAP Measures” section for the definitions thereof and reconciliations to the most comparable GAAP
measures.
43