ADT 2015 Annual Report Download - page 175
Download and view the complete annual report
Please find page 175 of the 2015 ADT annual report below. You can navigate through the pages in the report by either clicking on the pages listed below, or by using the keyword search tool below to find specific information within the annual report.-
 1
1 -
2
-
3
-
4
-
5
-
6
-
7
-
8
-
9
-
10
-
11
-
12
-
13
-
14
-
15
-
16
-
17
-
18
-
19
-
20
-
21
-
22
-
23
-
24
-
25
-
26
-
27
-
28
-
29
-
30
-
31
-
32
-
33
-
34
-
35
-
36
-
37
-
38
-
39
-
40
-
41
-
42
-
43
-
44
-
45
-
46
-
47
-
48
-
49
-
50
-
51
-
52
-
53
-
54
-
55
-
56
-
57
-
58
-
59
-
60
-
61
-
62
-
63
-
64
-
65
-
66
-
67
-
68
-
69
-
70
-
71
-
72
-
73
-
74
-
75
-
76
-
77
-
78
-
79
-
80
-
81
-
82
-
83
-
84
-
85
-
86
-
87
-
88
-
89
-
90
-
91
-
92
-
93
-
94
-
95
-
96
-
97
-
98
-
99
-
100
-
101
-
102
-
103
-
104
-
105
-
106
-
107
-
108
-
109
-
110
-
111
-
112
-
113
-
114
-
115
-
116
-
117
-
118
-
119
-
120
-
121
-
122
-
123
-
124
-
125
-
126
-
127
-
128
-
129
-
130
-
131
-
132
-
133
-
134
-
135
-
136
-
137
-
138
-
139
-
140
-
141
-
142
-
143
-
144
-
145
-
146
-
147
-
148
-
149
-
150
-
151
-
152
-
153
-
154
-
155
-
156
-
157
-
158
-
159
-
160
-
161
-
162
-
163
-
164
-
 165
165 -
 166
166 -
 167
167 -
 168
168 -
 169
169 -
 170
170 -
 171
171 -
 172
172 -
 173
173 -
 174
174 -
 175
175 -
 176
176 -
 177
177 -
 178
178 -
 179
179 -
 180
180 -
 181
181 -
 182
182 -
 183
183
 |
 |

FORM 10-K
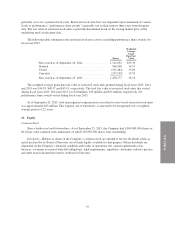
The computation of diluted earnings per share excludes potentially dilutive securities whose effect would
have been anti-dilutive in the amount of 2.3 million shares for fiscal year 2015, 1.7 million shares for fiscal year
2014 and 0.8 million shares for fiscal year 2013.
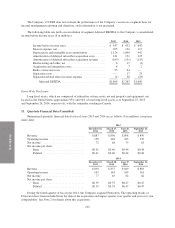
12. Segment Data
As discussed in Note 1, during the fourth quarter of fiscal year 2015, the manner in which the CODM
evaluates performance and makes decisions about how to allocate resources changed, resulting in the
reorganization of the Company’s operating segments. The Company now has two reportable segments, which are
the Company’s operating segments, United States and Canada. This change provides greater clarity and
transparency regarding the markets, financial performance and business model of the United States and Canada
businesses. All discussions and amounts reported below are based on the new segment structure.
The United States segment includes sales, installation and monitoring for residential, business, and health
customers in the United States and Puerto Rico, as well as corporate expenses and other operating costs
associated with support functions in the U.S.
The Canada segment includes sales, installation and monitoring for residential, business, and health
customers in Canada as well as operating expenses associated with certain support functions in Canada.
The accounting policies of the Company’s reportable segments are the same as those described in Note 1.
The Company’s CODM evaluates segment performance based on several factors, of which the primary
financial measures is on the basis of revenue and Adjusted EBITDA. Revenues are attributed to individual
countries based upon the operating entity that records the transaction. Adjusted EBITDA is defined as net income
adjusted for interest, taxes and certain non-cash items which include depreciation of subscriber system assets and
other fixed assets, amortization of deferred costs and deferred revenue associated with customer acquisitions, and
amortization of dealer and other intangible assets. Adjusted EBITDA is also adjusted to exclude charges and
gains related to acquisitions, restructurings, impairments, and other income or charges. Such items are excluded
to eliminate the impact of items that management does not consider indicative of the Company’s core operating
performance and/or business trends of the Company.
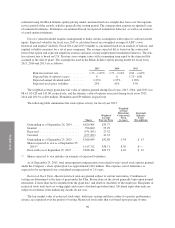
Segment results for the years ended September 25, 2015, September 26, 2014 and September 27, 2013 are
as follows ($ in millions):
2015 2014 2013
Revenue:
United States ...................................... $3,294 $3,206 $3,123
Canada ........................................... 280 202 186
Total ......................................... $3,574 $3,408 $3,309
2015 2014 2013
Adjusted EBITDA:
United States ...................................... $1,685 $1,671 $1,592
Canada ........................................... 123 96 98
Total ......................................... $1,808 $1,767 $1,690
2015 2014 2013
Depreciation and Amortization:
United States ...................................... $1,176 $1,104 $1,004
Canada ........................................... 89 67 61
Total ......................................... $1,265 $1,171 $1,065
101