ADT 2015 Annual Report Download - page 121
Download and view the complete annual report
Please find page 121 of the 2015 ADT annual report below. You can navigate through the pages in the report by either clicking on the pages listed below, or by using the keyword search tool below to find specific information within the annual report.-
 1
1 -
2
-
3
-
4
-
5
-
6
-
7
-
8
-
9
-
10
-
11
-
12
-
13
-
14
-
15
-
16
-
17
-
18
-
19
-
20
-
21
-
22
-
23
-
24
-
25
-
26
-
27
-
28
-
29
-
30
-
31
-
32
-
33
-
34
-
35
-
36
-
37
-
38
-
39
-
40
-
41
-
42
-
43
-
44
-
45
-
46
-
47
-
48
-
49
-
50
-
51
-
52
-
53
-
54
-
55
-
56
-
57
-
58
-
59
-
60
-
61
-
62
-
63
-
64
-
65
-
66
-
67
-
68
-
69
-
70
-
71
-
72
-
73
-
74
-
75
-
76
-
77
-
78
-
79
-
80
-
81
-
82
-
83
-
84
-
85
-
86
-
87
-
88
-
89
-
90
-
91
-
92
-
93
-
94
-
95
-
96
-
97
-
98
-
99
-
100
-
101
-
102
-
103
-
104
-
105
-
106
-
107
-
108
-
109
-
110
-
 111
111 -
 112
112 -
 113
113 -
 114
114 -
 115
115 -
 116
116 -
 117
117 -
 118
118 -
 119
119 -
 120
120 -
 121
121 -
 122
122 -
 123
123 -
 124
124 -
 125
125 -
 126
126 -
 127
127 -
 128
128 -
 129
129 -
 130
130 -
 131
131 -
132
-
133
-
134
-
135
-
136
-
137
-
138
-
139
-
140
-
141
-
142
-
143
-
144
-
145
-
146
-
147
-
148
-
149
-
150
-
151
-
152
-
153
-
154
-
155
-
156
-
157
-
158
-
159
-
160
-
161
-
162
-
163
-
164
-
165
-
166
-
167
-
168
-
169
-
170
-
171
-
172
-
173
-
174
-
175
-
176
-
177
-
178
-
179
-
180
-
181
-
182
-
183
 |
 |

FORM 10-K
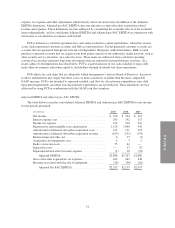
net impact of a $42 million favorable adjustment resulting from the resolution of certain unrecognized tax
benefits partially offset by the unfavorable deferred tax impact of $17 million from IRS audit adjustments.
Additionally, the fiscal year 2014 effective tax rate reflects the unfavorable impact resulting from $38 million in
non-deductible expense. See “Other Income (Expense)” above.
The effective tax rate can vary from period to period due to permanent tax adjustments, discrete items such
as the settlement of income tax audits and changes in tax laws, as well as recurring factors such as changes in the
overall effective state tax rate. See Note 6 to the Consolidated Financial Statements for more information on
income taxes.
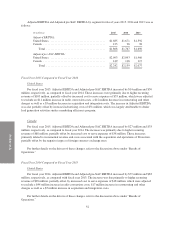
Year Ended September 26, 2014 Compared with Year Ended September 27, 2013
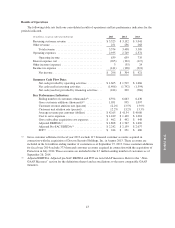
Revenue
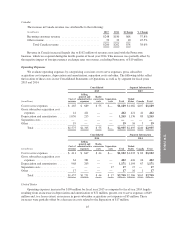
The increase in consolidated revenue was attributable to the following:
(in millions) 2014 2013 $ Change % Change
Recurring customer revenue ....................... $3,152 $3,041 $111 3.7%
Other revenue ................................... 256 268 (12) (4.5)%
Total consolidated revenue .................... $3,408 $3,309 $ 99 3.0%
Revenue by segment for fiscal year 2014 and fiscal year 2013 was as follows:
(in millions) 2014 2013 $ Change % Change
United States ................................... $3,206 $3,123 $83 2.7%
Canada ........................................ 202 186 16 8.6%
Total consolidated revenue .................... $3,408 $3,309 $99 3.0%
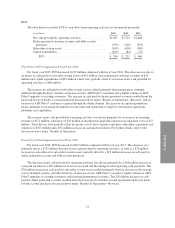
United States
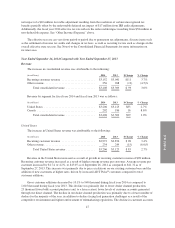
The increase in United States revenue was attributable to the following:
(in millions) 2014 2013 $ Change % Change
Recurring customer revenue ....................... $2,972 $2,874 $ 98 3.4%
Other revenue ................................... 234 249 (15) (6.0)%
Total United States revenue .................... $3,206 $3,123 $ 83 2.7%
Revenue in the United States increased as a result of growth in recurring customer revenue of $98 million.
Recurring customer revenue increased as a result of higher average revenue per customer. Average revenue per
customer increased by $1.74, or 4.2%, to $43.05 as of September 26, 2014 as compared to $41.31 as of
September 27, 2013. This increase was primarily due to price escalations on our existing customer base and the
addition of new customers at higher rates, driven by increased ADT Pulse®customers compared to total
customer additions.
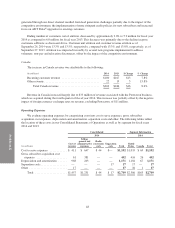
Gross customer additions decreased by 10.1% to 940 thousand during fiscal year 2014 as compared to
1,045 thousand during fiscal year 2013. This decline was primarily due to lower dealer channel production,
25 thousand fewer bulk account purchases and, to a lesser extent, lower levels of customer accounts generated
through our direct channel. The decline in our dealer channel production was primarily due to a lower number of
dealers for the majority of the year, in addition to dealers facing lead generation challenges as a result of the
competitive environment and tighter enforcement of telemarketing regulations. The decline in customer accounts
47