ADT 2015 Annual Report Download - page 147
Download and view the complete annual report
Please find page 147 of the 2015 ADT annual report below. You can navigate through the pages in the report by either clicking on the pages listed below, or by using the keyword search tool below to find specific information within the annual report.-
 1
1 -
2
-
3
-
4
-
5
-
6
-
7
-
8
-
9
-
10
-
11
-
12
-
13
-
14
-
15
-
16
-
17
-
18
-
19
-
20
-
21
-
22
-
23
-
24
-
25
-
26
-
27
-
28
-
29
-
30
-
31
-
32
-
33
-
34
-
35
-
36
-
37
-
38
-
39
-
40
-
41
-
42
-
43
-
44
-
45
-
46
-
47
-
48
-
49
-
50
-
51
-
52
-
53
-
54
-
55
-
56
-
57
-
58
-
59
-
60
-
61
-
62
-
63
-
64
-
65
-
66
-
67
-
68
-
69
-
70
-
71
-
72
-
73
-
74
-
75
-
76
-
77
-
78
-
79
-
80
-
81
-
82
-
83
-
84
-
85
-
86
-
87
-
88
-
89
-
90
-
91
-
92
-
93
-
94
-
95
-
96
-
97
-
98
-
99
-
100
-
101
-
102
-
103
-
104
-
105
-
106
-
107
-
108
-
109
-
110
-
111
-
112
-
113
-
114
-
115
-
116
-
117
-
118
-
119
-
120
-
121
-
122
-
123
-
124
-
125
-
126
-
127
-
128
-
129
-
130
-
131
-
132
-
133
-
134
-
135
-
136
-
 137
137 -
 138
138 -
 139
139 -
 140
140 -
 141
141 -
 142
142 -
 143
143 -
 144
144 -
 145
145 -
 146
146 -
 147
147 -
 148
148 -
 149
149 -
 150
150 -
 151
151 -
 152
152 -
 153
153 -
 154
154 -
 155
155 -
 156
156 -
 157
157 -
158
-
159
-
160
-
161
-
162
-
163
-
164
-
165
-
166
-
167
-
168
-
169
-
170
-
171
-
172
-
173
-
174
-
175
-
176
-
177
-
178
-
179
-
180
-
181
-
182
-
183
 |
 |

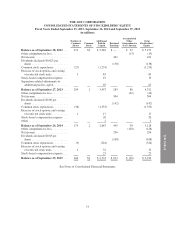
FORM 10-K
THE ADT CORPORATION
CONSOLIDATED STATEMENTS OF STOCKHOLDERS’ EQUITY
Fiscal Years Ended September 25, 2015, September 26, 2014 and September 27, 2013
(in millions)
Number of
Common
Shares
Common
Stock
Additional
Paid-In
Capital
Retained
Earnings
Accumulated
Other
Comprehensive
(Loss) Income
Total
Stockholders’
Equity
Balance as of September 28, 2012 . . . 231 $2 $ 5,062 $ — $ 93 $ 5,157
Other comprehensive loss ........... (13) (13)
Net income ...................... 421 421
Dividends declared ($0.625 per
share) ......................... (138) (138)
Common stock repurchases ......... (27) (1,274) (1,274)
Exercise of stock options and vesting
of restricted stock units ........... 5 85 85
Stock-based compensation expense . . . 19 19
Separation-related adjustments to
additional paid-in capital ......... 65 65
Balance as of September 27, 2013 . . . 209 2 3,957 283 80 4,322
Other comprehensive loss ........... (42) (42)
Net income ...................... 304 304
Dividends declared ($0.80 per
share) ......................... (142) (142)
Common stock repurchases ......... (36) (1,353) (1,353)
Exercise of stock options and vesting
of restricted stock units ........... 1 17 17
Stock-based compensation expense . . . 20 20
Other ........................... 2 2
Balance as of September 26, 2014 . . . 174 2 2,643 445 38 3,128
Other comprehensive loss ........... (128) (128)
Net income ...................... 296 296
Dividends declared ($0.63 per
share) ......................... (108) (108)
Common stock repurchases ......... (9) (324) (324)
Exercise of stock options and vesting
of restricted stock units ........... 1 32 32
Stock-based compensation expense . . . 23 23
Balance as of September 25, 2015 . . . 166 $2 $ 2,374 $ 633 $ (90) $ 2,919
See Notes to Consolidated Financial Statements
73