ADT 2015 Annual Report Download - page 37
Download and view the complete annual report
Please find page 37 of the 2015 ADT annual report below. You can navigate through the pages in the report by either clicking on the pages listed below, or by using the keyword search tool below to find specific information within the annual report.-
 1
1 -
2
-
3
-
4
-
5
-
6
-
7
-
8
-
9
-
10
-
11
-
12
-
13
-
14
-
15
-
16
-
17
-
18
-
19
-
20
-
21
-
22
-
23
-
24
-
25
-
26
-
 27
27 -
 28
28 -
 29
29 -
 30
30 -
 31
31 -
 32
32 -
 33
33 -
 34
34 -
 35
35 -
 36
36 -
 37
37 -
 38
38 -
 39
39 -
 40
40 -
 41
41 -
 42
42 -
 43
43 -
 44
44 -
 45
45 -
 46
46 -
 47
47 -
48
-
49
-
50
-
51
-
52
-
53
-
54
-
55
-
56
-
57
-
58
-
59
-
60
-
61
-
62
-
63
-
64
-
65
-
66
-
67
-
68
-
69
-
70
-
71
-
72
-
73
-
74
-
75
-
76
-
77
-
78
-
79
-
80
-
81
-
82
-
83
-
84
-
85
-
86
-
87
-
88
-
89
-
90
-
91
-
92
-
93
-
94
-
95
-
96
-
97
-
98
-
99
-
100
-
101
-
102
-
103
-
104
-
105
-
106
-
107
-
108
-
109
-
110
-
111
-
112
-
113
-
114
-
115
-
116
-
117
-
118
-
119
-
120
-
121
-
122
-
123
-
124
-
125
-
126
-
127
-
128
-
129
-
130
-
131
-
132
-
133
-
134
-
135
-
136
-
137
-
138
-
139
-
140
-
141
-
142
-
143
-
144
-
145
-
146
-
147
-
148
-
149
-
150
-
151
-
152
-
153
-
154
-
155
-
156
-
157
-
158
-
159
-
160
-
161
-
162
-
163
-
164
-
165
-
166
-
167
-
168
-
169
-
170
-
171
-
172
-
173
-
174
-
175
-
176
-
177
-
178
-
179
-
180
-
181
-
182
-
183
 |
 |
COMPENSATION OF EXECUTIVE OFFICERS—CONTINUED
sustainable long-term growth. Annual incentive compensation and
50% of target long-term equity incentive value is earned by the NEOs
only when the Company attains specified goals, thereby placing a
substantial portion of executive compensation at risk. The remaining
50% of executives’ target long-term equity incentive value is awarded
in Stock Options and time-vested Restricted Stock Units (“RSUs”),
the value of each of which is dependent on the Company’s stock
price performance.
Short-Term Incentives. We set aggressive targets in the annual
incentive plans for fiscal year 2015 that support both short- and long-
term success. In fiscal year 2015, the Company exceeded both
Recurring Revenue and Customer Retention targets in its Annual
Incentive Plan (“AIP”), while delivering EBITDA slightly below target
performance. Due to this overall above target performance, the CEO
was awarded an annual incentive equal to 139% of his targeted
award, and the other NEOs received an average payout of 140% of
their targeted awards, including the impact of each of their
performance against individual objectives.
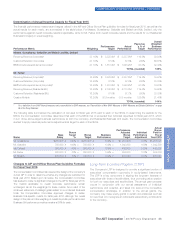
The chart below highlights the Company’s improving performance in
three key operating metrics (Recurring Revenue, Customer Retention
and EBITDA) over the past three fiscal years, as well as the annual
incentive compensation actually paid to the CEO over the same
period. We believe that these operating metrics have a strong
correlation with long-term value creation for our stockholders, and that
the associated improvement in these metrics is reflected in the annual
incentive compensation for the CEO.
FY2013
CEO Earned Annual
Incentive CompensationRecurring Revenue Customer Retention
EBITDA*
(before special items)
FY2014 FY2015FY2013 FY2014 FY2015 FY2013 FY2014 FY2015 FY2013 FY2014 FY2015
$1,400
$1,200
$1,000
$800
$600
$400
$200
$693
In Thousands
$630
$1,251
$0
$3,041
$3,152
$3,323
In Millions
$2,900
$2,950
$3,000
$3,050
$3,100
$3,150
$3,200
$3,250
$3,300
$3,350
% of Customers Retained (Units)
88.0%
87.8%
87.6%
87.4%
87.2%
87.0%
86.8%
86.6%
86.4%
86.2%
86.7% 86.8%
87.8%
86.0%
In Millions
$1,620
$1,640
$1,660
$1,680
$1,700
$1,720
$1,740
$1,760
$1,780
$1,800
$1,820
$1,690
$1,767
$1,808
* For a definition of non-GAAP financial measures and a reconciliation to GAAP measures, see “Reconciliation of Non-GAAP Measures to GAAP Measures and Selected Definitions” on
page 53 of this Proxy Statement.
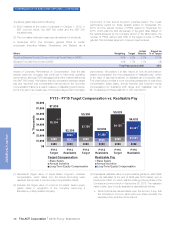
Long-Term Incentives. The fiscal year 2015 long-term incentive
program was designed to reward management for performance
directly related to increasing stockholder value. The CEO and the
other Executive Officers received 50% of their target long-term
incentive value in the form of Performance Share Units (“PSUs”),
whose vesting is contingent upon achieving EBITDA and Total
Shareholder Return (“TSR”) goals over a three-year performance
period. An additional 25% of target long-term incentive value for the
CEO and other Executive Officers was delivered in the form of Stock
Options, which deliver value only when long-term stock price
appreciation is achieved. The remaining 25% of target long-term
incentive value was awarded in the form of RSUs, which deliver
higher value when there is long-term stock price appreciation.
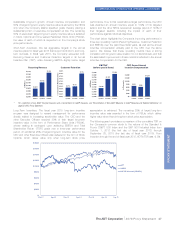
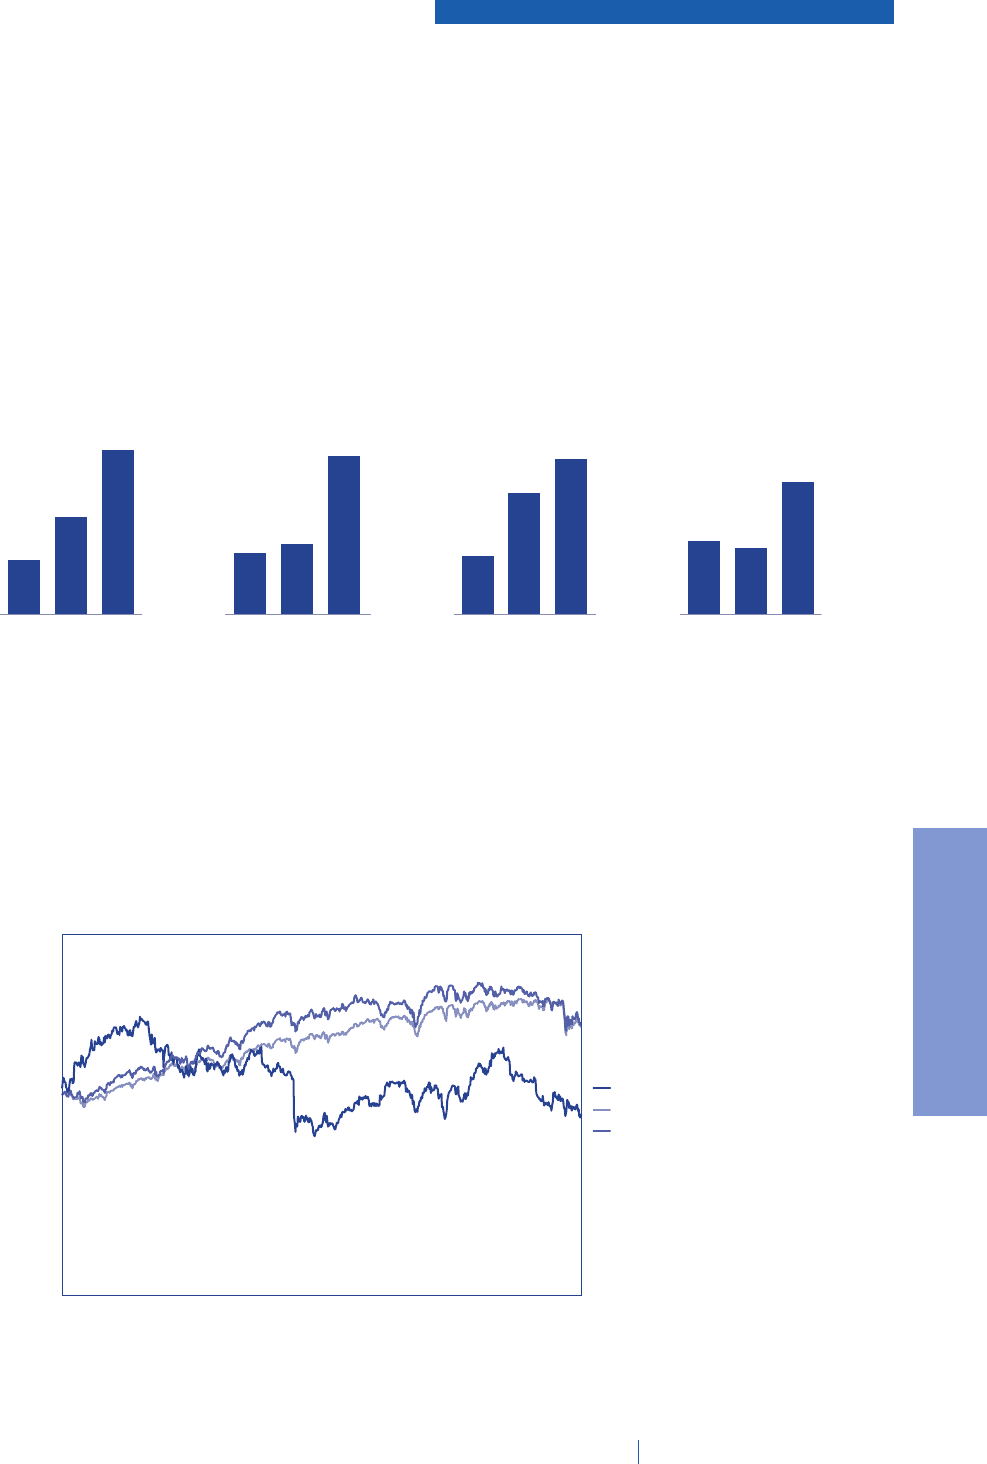
The following graph provides a comparison of the cumulative TSR on
the Company’s common stock to the returns of the Standard &
Poor’s (“S&P”) 500 Index and the S&P 500 Industrial Index from
October 1, 2012 (the first day of fiscal year 2013) through
September 25, 2015 (the last day of fiscal year 2015). From
inception through the end of fiscal year 2015, ADT’s TSR was -9.8%.
$160.00
$180.00
$140.00
$100.00
$120.00
$80.00
$40.00
$60.00
$20.00
$-
Oct-12 Apr-13 Oct-13 Apr-14 Oct-14 Apr-15 Sep-15
ADT
S&P500
S&P 500 Industrials (S5INDU)
The ADT Corporation 2016 Proxy Statement 27
PROXY STATEMENT