ADT 2015 Annual Report Download - page 162
Download and view the complete annual report
Please find page 162 of the 2015 ADT annual report below. You can navigate through the pages in the report by either clicking on the pages listed below, or by using the keyword search tool below to find specific information within the annual report.-
 1
1 -
2
-
3
-
4
-
5
-
6
-
7
-
8
-
9
-
10
-
11
-
12
-
13
-
14
-
15
-
16
-
17
-
18
-
19
-
20
-
21
-
22
-
23
-
24
-
25
-
26
-
27
-
28
-
29
-
30
-
31
-
32
-
33
-
34
-
35
-
36
-
37
-
38
-
39
-
40
-
41
-
42
-
43
-
44
-
45
-
46
-
47
-
48
-
49
-
50
-
51
-
52
-
53
-
54
-
55
-
56
-
57
-
58
-
59
-
60
-
61
-
62
-
63
-
64
-
65
-
66
-
67
-
68
-
69
-
70
-
71
-
72
-
73
-
74
-
75
-
76
-
77
-
78
-
79
-
80
-
81
-
82
-
83
-
84
-
85
-
86
-
87
-
88
-
89
-
90
-
91
-
92
-
93
-
94
-
95
-
96
-
97
-
98
-
99
-
100
-
101
-
102
-
103
-
104
-
105
-
106
-
107
-
108
-
109
-
110
-
111
-
112
-
113
-
114
-
115
-
116
-
117
-
118
-
119
-
120
-
121
-
122
-
123
-
124
-
125
-
126
-
127
-
128
-
129
-
130
-
131
-
132
-
133
-
134
-
135
-
136
-
137
-
138
-
139
-
140
-
141
-
142
-
143
-
144
-
145
-
146
-
147
-
148
-
149
-
150
-
151
-
 152
152 -
 153
153 -
 154
154 -
 155
155 -
 156
156 -
 157
157 -
 158
158 -
 159
159 -
 160
160 -
 161
161 -
 162
162 -
 163
163 -
 164
164 -
 165
165 -
 166
166 -
 167
167 -
 168
168 -
 169
169 -
 170
170 -
 171
171 -
 172
172 -
173
-
174
-
175
-
176
-
177
-
178
-
179
-
180
-
181
-
182
-
183
 |
 |

FORM 10-K
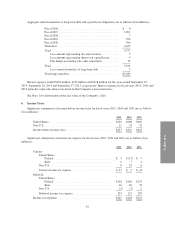
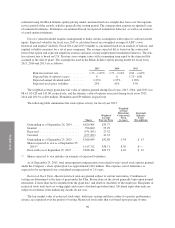
The reconciliations between the actual effective tax rate on continuing operations and the statutory U.S.
federal income tax rate for fiscal years 2015, 2014 and 2013 are as follows:
2015 2014 2013
Federal statutory tax rate ................................... 35.0% 35.0% 35.0%
Increases (reductions) in taxes due to:
U.S. state income tax provision, net ....................... 2.7% 4.2% 3.5%
Non-U.S. net earnings ................................. (1.2)% (0.5)% (0.5)%
Trademark amortization ................................ (5.3)% (5.3)% (3.6)%
Nondeductible charges ................................. — % — % (1.0)%
Resolution of unrecognized tax benefits ................... — % (6.5)% — %
2005-2009 IRS adjustments ............................. — % 3.7% — %
Other ............................................... 1.1% (1.0)% 1.0%
Provision for income taxes .................................. 32.3% 29.6% 34.4%
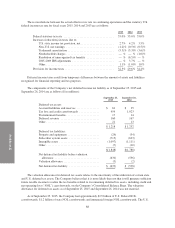
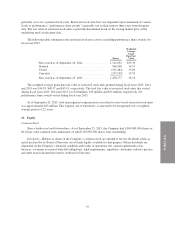
Deferred income taxes result from temporary differences between the amount of assets and liabilities
recognized for financial reporting and tax purposes.
The components of the Company’s net deferred income tax liability as of September 25, 2015 and
September 26, 2014 are as follows ($ in millions):
September 25,
2015
September 26,
2014
Deferred tax assets:
Accrued liabilities and reserves ................ $ 61 $ 35
Tax loss and credit carryforwards .............. 959 1,023
Postretirement benefits ....................... 17 14
Deferred revenue ........................... 160 167
Other ..................................... 21 13
$ 1,218 $ 1,252
Deferred tax liabilities:
Property and equipment ...................... (29) (34)
Subscriber system assets ..................... (715) (633)
Intangible assets ............................ (1,097) (1,111)
Other ..................................... (7) (10)
$(1,848) $(1,788)
Net deferred tax liability before valuation
allowance ............................... (630) (536)
Valuation allowance ......................... (3) (2)
Net deferred tax liability ..................... $ (633) $ (538)
The valuation allowance for deferred tax assets relates to the uncertainty of the utilization of certain state
and U.S. deferred tax assets. The Company believes that it is more likely than not that it will generate sufficient
future taxable income to realize the tax benefits related to its remaining deferred tax assets, including credit and
net operating loss (“NOL”) carryforwards, on the Company’s Consolidated Balance Sheet. The valuation
allowance for deferred tax assets as of September 25, 2015 and September 26, 2014 was not material.
As of September 25, 2015, the Company had approximately $2.5 billion of U.S. Federal NOL
carryforwards, $1.2 billion of state NOL carryforwards and immaterial foreign NOL carryforwards. The U.S.
88