ADT 2015 Annual Report Download - page 49
Download and view the complete annual report
Please find page 49 of the 2015 ADT annual report below. You can navigate through the pages in the report by either clicking on the pages listed below, or by using the keyword search tool below to find specific information within the annual report.-
 1
1 -
2
-
3
-
4
-
5
-
6
-
7
-
8
-
9
-
10
-
11
-
12
-
13
-
14
-
15
-
16
-
17
-
18
-
19
-
20
-
21
-
22
-
23
-
24
-
25
-
26
-
27
-
28
-
29
-
30
-
31
-
32
-
33
-
34
-
35
-
36
-
37
-
38
-
 39
39 -
 40
40 -
 41
41 -
 42
42 -
 43
43 -
 44
44 -
 45
45 -
 46
46 -
 47
47 -
 48
48 -
 49
49 -
 50
50 -
 51
51 -
 52
52 -
 53
53 -
 54
54 -
 55
55 -
 56
56 -
 57
57 -
 58
58 -
 59
59 -
60
-
61
-
62
-
63
-
64
-
65
-
66
-
67
-
68
-
69
-
70
-
71
-
72
-
73
-
74
-
75
-
76
-
77
-
78
-
79
-
80
-
81
-
82
-
83
-
84
-
85
-
86
-
87
-
88
-
89
-
90
-
91
-
92
-
93
-
94
-
95
-
96
-
97
-
98
-
99
-
100
-
101
-
102
-
103
-
104
-
105
-
106
-
107
-
108
-
109
-
110
-
111
-
112
-
113
-
114
-
115
-
116
-
117
-
118
-
119
-
120
-
121
-
122
-
123
-
124
-
125
-
126
-
127
-
128
-
129
-
130
-
131
-
132
-
133
-
134
-
135
-
136
-
137
-
138
-
139
-
140
-
141
-
142
-
143
-
144
-
145
-
146
-
147
-
148
-
149
-
150
-
151
-
152
-
153
-
154
-
155
-
156
-
157
-
158
-
159
-
160
-
161
-
162
-
163
-
164
-
165
-
166
-
167
-
168
-
169
-
170
-
171
-
172
-
173
-
174
-
175
-
176
-
177
-
178
-
179
-
180
-
181
-
182
-
183
 |
 |

FISCAL YEAR 2015 NEO COMPENSATION
FISCAL YEAR 2015 NEO COMPENSATION
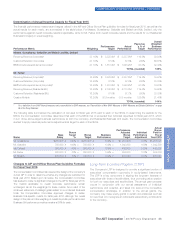
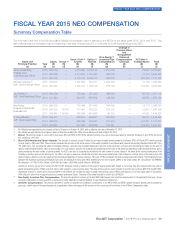
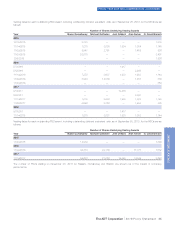
Summary Compensation Table
The information set forth in the following table reflects compensation paid or earned by the NEOs for the fiscal years 2015, 2014 and 2013. The
table reflects total compensation earned beginning in the later of fiscal year 2013 or the year an individual first became an NEO.
Name and
Principal Position Year Salary
($) Bonus (3)
($)
Stock / Unit (4)
Awards
($)
Option (4)
Awards
($)
Non-Equity (5)
Incentive Plan
Compensation
($)
Change in
Pension Value
and
Nonqualified
Deferred
Compensation
Earnings
($)
All Other (6)
Compensation
($) Total
($)
(a) (b) (c) (d) (e) (f) (g) (h) (i) (j)
Naren Gursahaney
President and
Chief Executive Officer
2015 900,009 — 2,778,962 1,004,154 1,251,000 — 76,502 6,010,627
2014 900,026 — 2,716,602 1,148,360 630,000 — 70,400 5,465,388
2013 900,000 — 2,708,100 2,602,377 693,000 — 267,286 7,170,763
Michael Geltzeiler (1)
SVP, Chief Financial Officer
2015 750,007 — 1,387,852 502,077 1,042,500 — 81,156 3,763,592
2014 661,953 — 1,853,414 1,186,135 538,125 — 102,057 4,341,684
Jerri DeVard (2)
SVP, Chief Marketing Officer
2015 500,000 — 739,445 267,438 486,500 — 63,736 2,057,119
2014 251,924 — 520,078 665,952 126,594 — 90,552 1,655,100
Alan Ferber
President, Residential
Business Unit
2015 500,000 — 739,445 267,438 504,000 — 35,714 2,046,597
2014 500,002 75,000 718,401 305,222 235,200 — 22,975 1,856,800
2013 204,545 115,000 498,064 498,456 90,383 — 47,843 1,454,291
N. David Bleisch
SVP, Chief Legal Officer
2015 434,171 — 438,901 160,631 467,040 — 42,811 1,543,554
2014 425,012 — 580,489 182,831 211,374 — 337,531 1,737,237
2013 391,667 — 417,690 320,529 191,221 — 126,404 1,447,511
(1) Mr. Geltzeiler was appointed by the Company’s Board of Directors on October 14, 2013, with an effective start date of November 11, 2013.
(2) Ms. DeVard was appointed by the Company’s Board of Directors on March 24, 2014, with an effective start date of March 31, 2014.
(3) Bonus: The amounts shown in column (d) in fiscal years 2014 and 2013 for Mr. Ferber represent portions of a sign-on bonus paid when he joined the Company in April 2013, and on the
first anniversary of his hire.
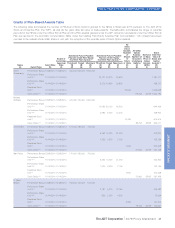
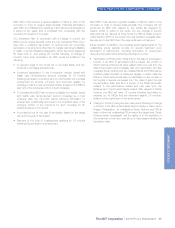
(4) Stock/Unit Awards and Option Awards: The amounts in columns (e) and (f) reflect the fair value of equity awards granted in fiscal years 2015, 2014 and 2013, which consisted
of stock options, RSUs and PSUs. These amounts represent the fair value of the entire amount of the award calculated in accordance with Financial Accounting Standards Board ASC Topic
718 (ASC Topic 718), excluding the effect of estimated forfeitures. Amounts were calculated based upon the price of the Company’s common stock (including the impact on the value of
options under the Black-Scholes option pricing model). For stock options, amounts are computed by multiplying the fair value of the award (as determined under the Black-Scholes option
pricing model) by the total number of options granted. For RSUs, fair value is computed by multiplying the total number of shares subject to the award by the closing market price of the
Company’s common stock on the date of grant. For PSUs, fair value is based on a model that considers the closing market price of the Company’s common stock on the date of grant, the
range of shares subject to such stock award and the estimated probabilities of vesting outcomes. The value of PSUs included in the table assumes target performance. The following amounts
represent the maximum potential performance share value by individual for fiscal year 2015, determined at the time of grant (200% of the target award): Mr. Gursahaney—$3,499,868;
Mr. Geltzeiler—$1,746,676; Ms. DeVard—$931,995; Mr. Ferber—$931,995; and Mr. Bleisch—$553,982.
Amounts in columns (e) and (f) for fiscal year 2014 for Mr. Geltzeiler include, in addition to the value of awards granted with respect to our annual long-term incentive plan, the value of
awards representing grants of RSUs and stock options with respect to a sign-on equity award. The value of these sign-on grants included in columns (e) and (f) are $497,313 and $611,955,
respectively. Amount in column (e) for fiscal year 2014 for Mr. Bleisch also includes the value of awards representing a grant of RSUs with respect to a one-time equity award in recognition
of Mr. Bleisch’s critical role in supporting various Company governance issues. The value of this award included in column (e) is $146,853.
(5) Non-Equity Incentive Plan Compensation: The amounts reported in column (g) for each NEO reflect annual cash incentive compensation for the applicable fiscal year. Annual
incentive compensation for fiscal year 2015 is discussed in further detail above under the heading “Annual Incentive Compensation.”
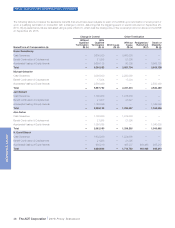
(6) All Other Compensation: The amounts reported in column (i) represent the Company’s contributions to its 401(k) RSIP and SSRP, taxable relocation benefits and associated tax
gross-ups, and the value of the executive physical, as applicable. Details with respect to the amounts in this column are set forth below, in the All Other Compensation table.
The ADT Corporation 2016 Proxy Statement 39
PROXY STATEMENT